Czechoslovakian vs Immigrants from South Africa Male Unemployment
COMPARE
Czechoslovakian
Immigrants from South Africa
Male Unemployment
Male Unemployment Comparison
Czechoslovakians
Immigrants from South Africa
5.0%
MALE UNEMPLOYMENT
98.7/ 100
METRIC RATING
55th/ 347
METRIC RANK
5.0%
MALE UNEMPLOYMENT
97.1/ 100
METRIC RATING
72nd/ 347
METRIC RANK
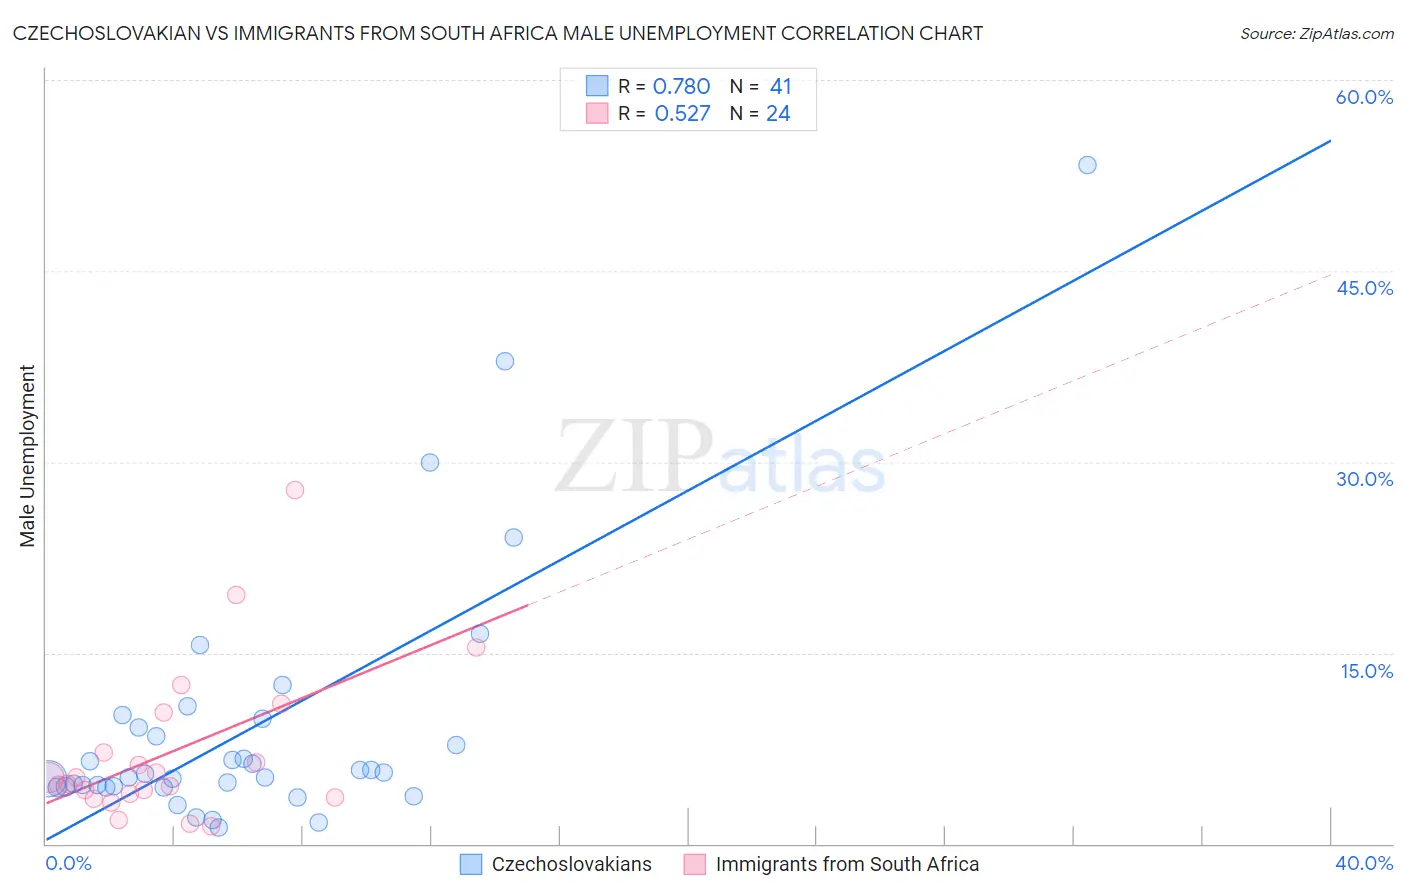
Czechoslovakian vs Immigrants from South Africa Male Unemployment Correlation Chart
The statistical analysis conducted on geographies consisting of 366,692,431 people shows a strong positive correlation between the proportion of Czechoslovakians and unemployment rate among males in the United States with a correlation coefficient (R) of 0.780 and weighted average of 5.0%. Similarly, the statistical analysis conducted on geographies consisting of 232,631,377 people shows a substantial positive correlation between the proportion of Immigrants from South Africa and unemployment rate among males in the United States with a correlation coefficient (R) of 0.527 and weighted average of 5.0%, a difference of 1.3%.
Male Unemployment Correlation Summary
| Measurement | Czechoslovakian | Immigrants from South Africa |
| Minimum | 1.3% | 1.4% |
| Maximum | 53.3% | 27.8% |
| Range | 52.0% | 26.4% |
| Mean | 9.1% | 7.2% |
| Median | 5.5% | 5.0% |
| Interquartile 25% (IQ1) | 4.5% | 3.8% |
| Interquartile 75% (IQ3) | 9.5% | 8.7% |
| Interquartile Range (IQR) | 5.1% | 5.0% |
| Standard Deviation (Sample) | 10.2% | 6.2% |
| Standard Deviation (Population) | 10.1% | 6.1% |
Demographics Similar to Czechoslovakians and Immigrants from South Africa by Male Unemployment
In terms of male unemployment, the demographic groups most similar to Czechoslovakians are Yugoslavian (5.0%, a difference of 0.0%), Immigrants from Bulgaria (5.0%, a difference of 0.0%), Jordanian (5.0%, a difference of 0.11%), Turkish (5.0%, a difference of 0.24%), and Lithuanian (5.0%, a difference of 0.24%). Similarly, the demographic groups most similar to Immigrants from South Africa are New Zealander (5.0%, a difference of 0.070%), Greek (5.0%, a difference of 0.080%), White/Caucasian (5.0%, a difference of 0.090%), Immigrants from Sweden (5.0%, a difference of 0.15%), and Australian (5.0%, a difference of 0.18%).
| Demographics | Rating | Rank | Male Unemployment |
| Jordanians | 98.8 /100 | #53 | Exceptional 5.0% |
| Yugoslavians | 98.7 /100 | #54 | Exceptional 5.0% |
| Czechoslovakians | 98.7 /100 | #55 | Exceptional 5.0% |
| Immigrants | Bulgaria | 98.7 /100 | #56 | Exceptional 5.0% |
| Turks | 98.5 /100 | #57 | Exceptional 5.0% |
| Lithuanians | 98.5 /100 | #58 | Exceptional 5.0% |
| Immigrants | Netherlands | 98.3 /100 | #59 | Exceptional 5.0% |
| Immigrants | Argentina | 98.1 /100 | #60 | Exceptional 5.0% |
| Cambodians | 98.1 /100 | #61 | Exceptional 5.0% |
| Basques | 97.9 /100 | #62 | Exceptional 5.0% |
| Eastern Europeans | 97.9 /100 | #63 | Exceptional 5.0% |
| Celtics | 97.8 /100 | #64 | Exceptional 5.0% |
| Icelanders | 97.6 /100 | #65 | Exceptional 5.0% |
| Finns | 97.5 /100 | #66 | Exceptional 5.0% |
| Immigrants | Canada | 97.5 /100 | #67 | Exceptional 5.0% |
| Australians | 97.4 /100 | #68 | Exceptional 5.0% |
| Immigrants | Sweden | 97.4 /100 | #69 | Exceptional 5.0% |
| Whites/Caucasians | 97.3 /100 | #70 | Exceptional 5.0% |
| New Zealanders | 97.3 /100 | #71 | Exceptional 5.0% |
| Immigrants | South Africa | 97.1 /100 | #72 | Exceptional 5.0% |
| Greeks | 97.0 /100 | #73 | Exceptional 5.0% |