Asian vs Immigrants from South Africa Male Unemployment
COMPARE
Asian
Immigrants from South Africa
Male Unemployment
Male Unemployment Comparison
Asians
Immigrants from South Africa
5.1%
MALE UNEMPLOYMENT
93.7/ 100
METRIC RATING
96th/ 347
METRIC RANK
5.0%
MALE UNEMPLOYMENT
97.1/ 100
METRIC RATING
72nd/ 347
METRIC RANK
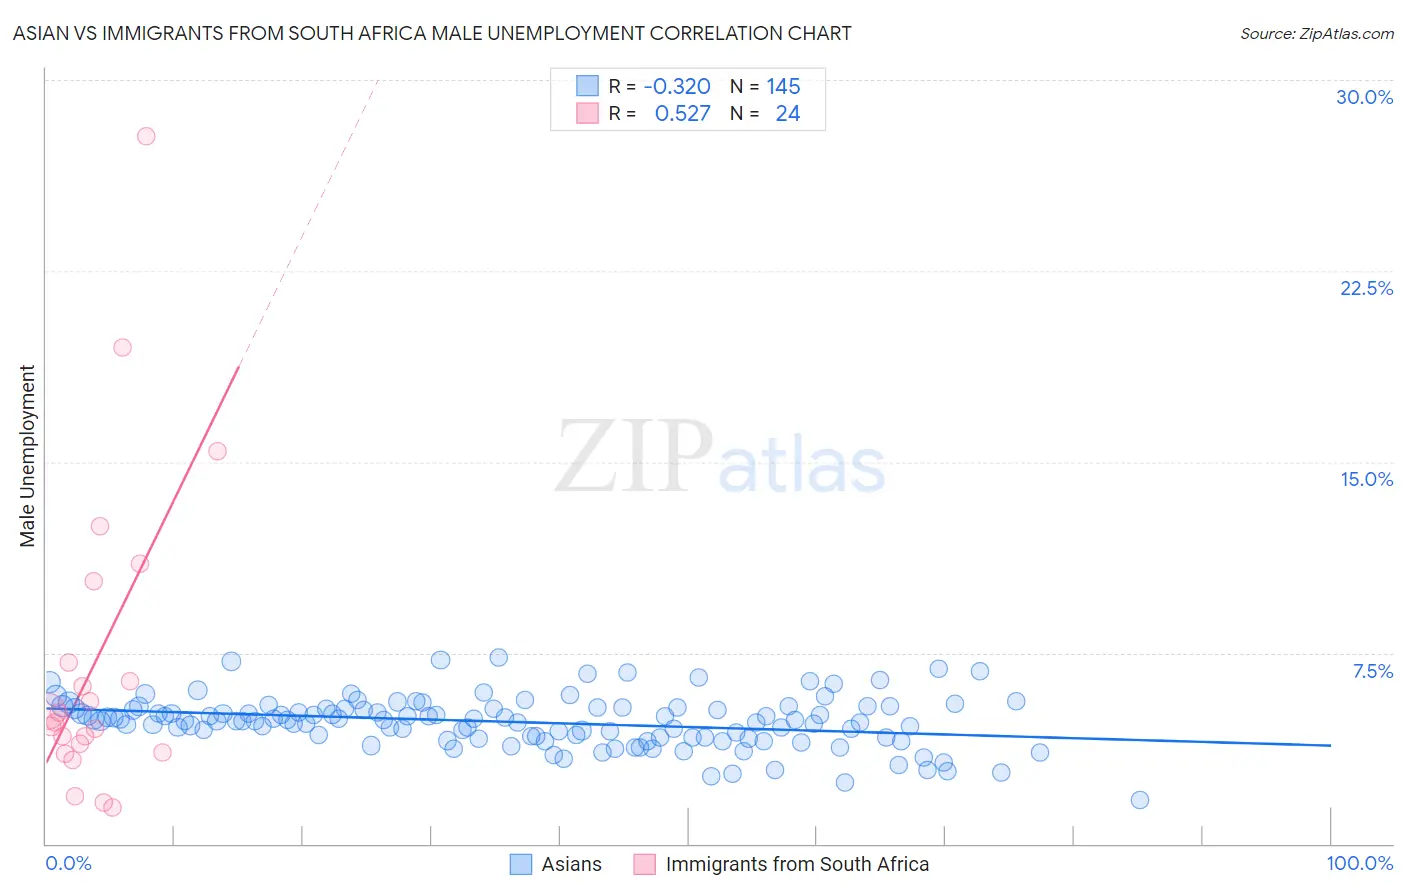
Asian vs Immigrants from South Africa Male Unemployment Correlation Chart
The statistical analysis conducted on geographies consisting of 543,892,334 people shows a mild negative correlation between the proportion of Asians and unemployment rate among males in the United States with a correlation coefficient (R) of -0.320 and weighted average of 5.1%. Similarly, the statistical analysis conducted on geographies consisting of 232,631,377 people shows a substantial positive correlation between the proportion of Immigrants from South Africa and unemployment rate among males in the United States with a correlation coefficient (R) of 0.527 and weighted average of 5.0%, a difference of 1.3%.
Male Unemployment Correlation Summary
| Measurement | Asian | Immigrants from South Africa |
| Minimum | 1.7% | 1.4% |
| Maximum | 7.3% | 27.8% |
| Range | 5.6% | 26.4% |
| Mean | 4.8% | 7.2% |
| Median | 4.8% | 5.0% |
| Interquartile 25% (IQ1) | 4.2% | 3.8% |
| Interquartile 75% (IQ3) | 5.3% | 8.7% |
| Interquartile Range (IQR) | 1.1% | 5.0% |
| Standard Deviation (Sample) | 0.98% | 6.2% |
| Standard Deviation (Population) | 0.98% | 6.1% |
Similar Demographics by Male Unemployment
Demographics Similar to Asians by Male Unemployment
In terms of male unemployment, the demographic groups most similar to Asians are Italian (5.1%, a difference of 0.030%), Immigrants from Spain (5.1%, a difference of 0.070%), Canadian (5.1%, a difference of 0.10%), Immigrants from Kuwait (5.1%, a difference of 0.11%), and Slavic (5.1%, a difference of 0.15%).
| Demographics | Rating | Rank | Male Unemployment |
| Immigrants | Australia | 94.7 /100 | #89 | Exceptional 5.1% |
| Okinawans | 94.7 /100 | #90 | Exceptional 5.1% |
| Immigrants | Turkey | 94.4 /100 | #91 | Exceptional 5.1% |
| Slavs | 94.2 /100 | #92 | Exceptional 5.1% |
| Immigrants | Serbia | 94.2 /100 | #93 | Exceptional 5.1% |
| Canadians | 94.1 /100 | #94 | Exceptional 5.1% |
| Italians | 93.8 /100 | #95 | Exceptional 5.1% |
| Asians | 93.7 /100 | #96 | Exceptional 5.1% |
| Immigrants | Spain | 93.4 /100 | #97 | Exceptional 5.1% |
| Immigrants | Kuwait | 93.3 /100 | #98 | Exceptional 5.1% |
| Uruguayans | 93.0 /100 | #99 | Exceptional 5.1% |
| Russians | 92.9 /100 | #100 | Exceptional 5.1% |
| German Russians | 92.7 /100 | #101 | Exceptional 5.1% |
| Immigrants | France | 92.7 /100 | #102 | Exceptional 5.1% |
| Immigrants | Jordan | 91.9 /100 | #103 | Exceptional 5.1% |
Demographics Similar to Immigrants from South Africa by Male Unemployment
In terms of male unemployment, the demographic groups most similar to Immigrants from South Africa are New Zealander (5.0%, a difference of 0.070%), Greek (5.0%, a difference of 0.080%), White/Caucasian (5.0%, a difference of 0.090%), Immigrants from North America (5.0%, a difference of 0.11%), and Assyrian/Chaldean/Syriac (5.0%, a difference of 0.14%).
| Demographics | Rating | Rank | Male Unemployment |
| Icelanders | 97.6 /100 | #65 | Exceptional 5.0% |
| Finns | 97.5 /100 | #66 | Exceptional 5.0% |
| Immigrants | Canada | 97.5 /100 | #67 | Exceptional 5.0% |
| Australians | 97.4 /100 | #68 | Exceptional 5.0% |
| Immigrants | Sweden | 97.4 /100 | #69 | Exceptional 5.0% |
| Whites/Caucasians | 97.3 /100 | #70 | Exceptional 5.0% |
| New Zealanders | 97.3 /100 | #71 | Exceptional 5.0% |
| Immigrants | South Africa | 97.1 /100 | #72 | Exceptional 5.0% |
| Greeks | 97.0 /100 | #73 | Exceptional 5.0% |
| Immigrants | North America | 96.9 /100 | #74 | Exceptional 5.0% |
| Assyrians/Chaldeans/Syriacs | 96.9 /100 | #75 | Exceptional 5.0% |
| Immigrants | Sudan | 96.5 /100 | #76 | Exceptional 5.0% |
| Iranians | 96.4 /100 | #77 | Exceptional 5.0% |
| Immigrants | Northern Europe | 96.4 /100 | #78 | Exceptional 5.0% |
| South Africans | 96.4 /100 | #79 | Exceptional 5.0% |