Immigrants vs Immigrants from South Africa Male Unemployment
COMPARE
Immigrants
Immigrants from South Africa
Male Unemployment
Male Unemployment Comparison
Immigrants
Immigrants from South Africa
5.5%
MALE UNEMPLOYMENT
4.3/ 100
METRIC RATING
216th/ 347
METRIC RANK
5.0%
MALE UNEMPLOYMENT
97.1/ 100
METRIC RATING
72nd/ 347
METRIC RANK
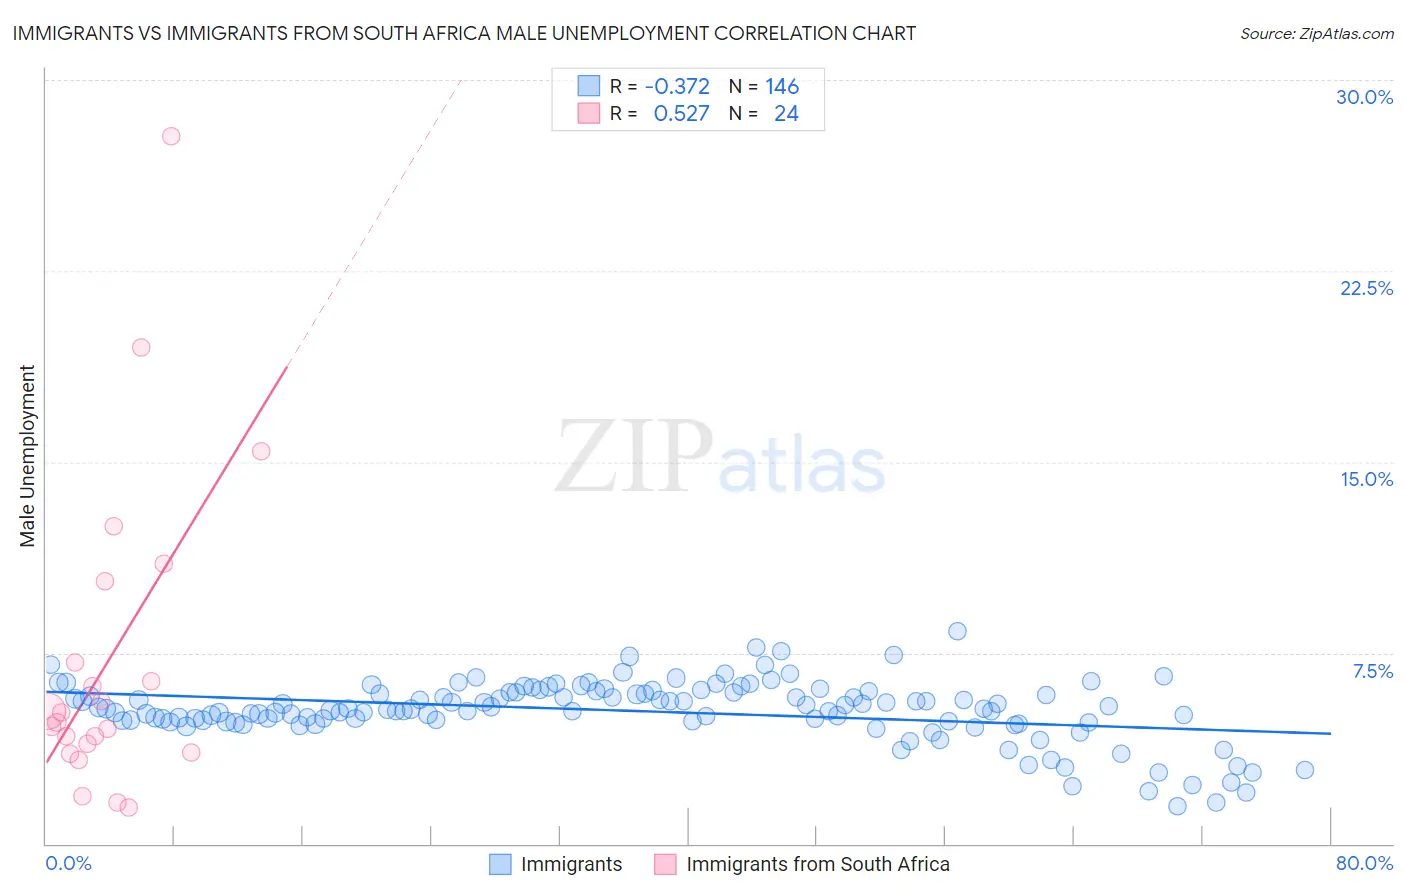
Immigrants vs Immigrants from South Africa Male Unemployment Correlation Chart
The statistical analysis conducted on geographies consisting of 566,323,513 people shows a mild negative correlation between the proportion of Immigrants and unemployment rate among males in the United States with a correlation coefficient (R) of -0.372 and weighted average of 5.5%. Similarly, the statistical analysis conducted on geographies consisting of 232,631,377 people shows a substantial positive correlation between the proportion of Immigrants from South Africa and unemployment rate among males in the United States with a correlation coefficient (R) of 0.527 and weighted average of 5.0%, a difference of 10.2%.
Male Unemployment Correlation Summary
| Measurement | Immigrants | Immigrants from South Africa |
| Minimum | 1.5% | 1.4% |
| Maximum | 8.4% | 27.8% |
| Range | 6.9% | 26.4% |
| Mean | 5.2% | 7.2% |
| Median | 5.3% | 5.0% |
| Interquartile 25% (IQ1) | 4.8% | 3.8% |
| Interquartile 75% (IQ3) | 5.9% | 8.7% |
| Interquartile Range (IQR) | 1.1% | 5.0% |
| Standard Deviation (Sample) | 1.2% | 6.2% |
| Standard Deviation (Population) | 1.2% | 6.1% |
Similar Demographics by Male Unemployment
Demographics Similar to Immigrants by Male Unemployment
In terms of male unemployment, the demographic groups most similar to Immigrants are Delaware (5.5%, a difference of 0.050%), Samoan (5.5%, a difference of 0.17%), Immigrants from Albania (5.5%, a difference of 0.26%), Immigrants from Western Asia (5.6%, a difference of 0.31%), and Portuguese (5.6%, a difference of 0.33%).
| Demographics | Rating | Rank | Male Unemployment |
| Immigrants | Middle Africa | 8.3 /100 | #209 | Tragic 5.5% |
| South American Indians | 7.6 /100 | #210 | Tragic 5.5% |
| Israelis | 7.4 /100 | #211 | Tragic 5.5% |
| Hmong | 7.0 /100 | #212 | Tragic 5.5% |
| Ugandans | 6.3 /100 | #213 | Tragic 5.5% |
| Puget Sound Salish | 5.6 /100 | #214 | Tragic 5.5% |
| Samoans | 4.9 /100 | #215 | Tragic 5.5% |
| Immigrants | Immigrants | 4.3 /100 | #216 | Tragic 5.5% |
| Delaware | 4.2 /100 | #217 | Tragic 5.5% |
| Immigrants | Albania | 3.6 /100 | #218 | Tragic 5.5% |
| Immigrants | Western Asia | 3.5 /100 | #219 | Tragic 5.6% |
| Portuguese | 3.5 /100 | #220 | Tragic 5.6% |
| Soviet Union | 3.2 /100 | #221 | Tragic 5.6% |
| Immigrants | Micronesia | 2.9 /100 | #222 | Tragic 5.6% |
| Creek | 2.6 /100 | #223 | Tragic 5.6% |
Demographics Similar to Immigrants from South Africa by Male Unemployment
In terms of male unemployment, the demographic groups most similar to Immigrants from South Africa are New Zealander (5.0%, a difference of 0.070%), Greek (5.0%, a difference of 0.080%), White/Caucasian (5.0%, a difference of 0.090%), Immigrants from North America (5.0%, a difference of 0.11%), and Assyrian/Chaldean/Syriac (5.0%, a difference of 0.14%).
| Demographics | Rating | Rank | Male Unemployment |
| Icelanders | 97.6 /100 | #65 | Exceptional 5.0% |
| Finns | 97.5 /100 | #66 | Exceptional 5.0% |
| Immigrants | Canada | 97.5 /100 | #67 | Exceptional 5.0% |
| Australians | 97.4 /100 | #68 | Exceptional 5.0% |
| Immigrants | Sweden | 97.4 /100 | #69 | Exceptional 5.0% |
| Whites/Caucasians | 97.3 /100 | #70 | Exceptional 5.0% |
| New Zealanders | 97.3 /100 | #71 | Exceptional 5.0% |
| Immigrants | South Africa | 97.1 /100 | #72 | Exceptional 5.0% |
| Greeks | 97.0 /100 | #73 | Exceptional 5.0% |
| Immigrants | North America | 96.9 /100 | #74 | Exceptional 5.0% |
| Assyrians/Chaldeans/Syriacs | 96.9 /100 | #75 | Exceptional 5.0% |
| Immigrants | Sudan | 96.5 /100 | #76 | Exceptional 5.0% |
| Iranians | 96.4 /100 | #77 | Exceptional 5.0% |
| Immigrants | Northern Europe | 96.4 /100 | #78 | Exceptional 5.0% |
| South Africans | 96.4 /100 | #79 | Exceptional 5.0% |