Cuban vs Thai 1st Grade
COMPARE
Cuban
Thai
1st Grade
1st Grade Comparison
Cubans
Thais
97.5%
1ST GRADE
0.3/ 100
METRIC RATING
265th/ 347
METRIC RANK
98.1%
1ST GRADE
94.7/ 100
METRIC RATING
119th/ 347
METRIC RANK
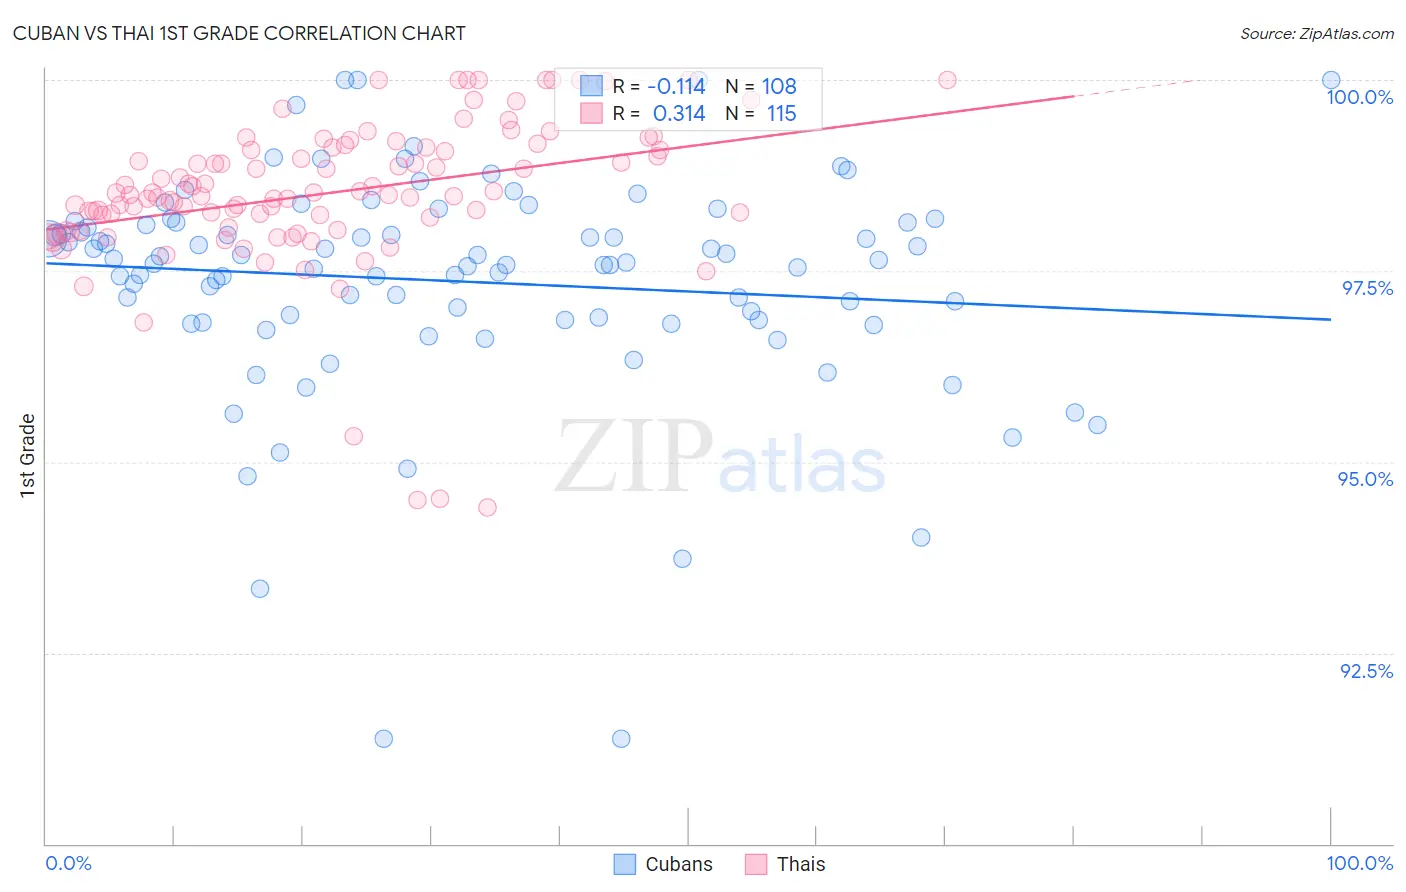
Cuban vs Thai 1st Grade Correlation Chart
The statistical analysis conducted on geographies consisting of 449,326,865 people shows a poor negative correlation between the proportion of Cubans and percentage of population with at least 1st grade education in the United States with a correlation coefficient (R) of -0.114 and weighted average of 97.5%. Similarly, the statistical analysis conducted on geographies consisting of 475,866,115 people shows a mild positive correlation between the proportion of Thais and percentage of population with at least 1st grade education in the United States with a correlation coefficient (R) of 0.314 and weighted average of 98.1%, a difference of 0.67%.
1st Grade Correlation Summary
| Measurement | Cuban | Thai |
| Minimum | 91.4% | 94.4% |
| Maximum | 100.0% | 100.0% |
| Range | 8.6% | 5.6% |
| Mean | 97.4% | 98.5% |
| Median | 97.6% | 98.5% |
| Interquartile 25% (IQ1) | 96.9% | 98.1% |
| Interquartile 75% (IQ3) | 98.1% | 99.1% |
| Interquartile Range (IQR) | 1.3% | 1.0% |
| Standard Deviation (Sample) | 1.5% | 1.0% |
| Standard Deviation (Population) | 1.5% | 1.0% |
Similar Demographics by 1st Grade
Demographics Similar to Cubans by 1st Grade
In terms of 1st grade, the demographic groups most similar to Cubans are Immigrants from Liberia (97.5%, a difference of 0.0%), Immigrants from Sierra Leone (97.5%, a difference of 0.0%), Immigrants from South America (97.5%, a difference of 0.010%), Taiwanese (97.5%, a difference of 0.010%), and Immigrants from Nigeria (97.5%, a difference of 0.010%).
| Demographics | Rating | Rank | 1st Grade |
| Indians (Asian) | 0.6 /100 | #258 | Tragic 97.5% |
| Fijians | 0.5 /100 | #259 | Tragic 97.5% |
| Armenians | 0.5 /100 | #260 | Tragic 97.5% |
| Immigrants | Ethiopia | 0.4 /100 | #261 | Tragic 97.5% |
| Assyrians/Chaldeans/Syriacs | 0.4 /100 | #262 | Tragic 97.5% |
| Immigrants | South America | 0.4 /100 | #263 | Tragic 97.5% |
| Taiwanese | 0.4 /100 | #264 | Tragic 97.5% |
| Cubans | 0.3 /100 | #265 | Tragic 97.5% |
| Immigrants | Liberia | 0.3 /100 | #266 | Tragic 97.5% |
| Immigrants | Sierra Leone | 0.3 /100 | #267 | Tragic 97.5% |
| Immigrants | Nigeria | 0.3 /100 | #268 | Tragic 97.5% |
| West Indians | 0.3 /100 | #269 | Tragic 97.5% |
| Immigrants | Jamaica | 0.2 /100 | #270 | Tragic 97.5% |
| Immigrants | Cameroon | 0.2 /100 | #271 | Tragic 97.4% |
| Immigrants | Peru | 0.2 /100 | #272 | Tragic 97.4% |
Demographics Similar to Thais by 1st Grade
In terms of 1st grade, the demographic groups most similar to Thais are Okinawan (98.1%, a difference of 0.0%), Yugoslavian (98.2%, a difference of 0.010%), Immigrants from France (98.2%, a difference of 0.010%), Immigrants from Zimbabwe (98.1%, a difference of 0.010%), and Menominee (98.1%, a difference of 0.010%).
| Demographics | Rating | Rank | 1st Grade |
| Immigrants | Norway | 96.6 /100 | #112 | Exceptional 98.2% |
| Immigrants | Latvia | 96.4 /100 | #113 | Exceptional 98.2% |
| Ute | 96.2 /100 | #114 | Exceptional 98.2% |
| Iranians | 96.0 /100 | #115 | Exceptional 98.2% |
| Spanish | 95.9 /100 | #116 | Exceptional 98.2% |
| Yugoslavians | 95.5 /100 | #117 | Exceptional 98.2% |
| Immigrants | France | 95.5 /100 | #118 | Exceptional 98.2% |
| Thais | 94.7 /100 | #119 | Exceptional 98.1% |
| Okinawans | 94.5 /100 | #120 | Exceptional 98.1% |
| Immigrants | Zimbabwe | 94.0 /100 | #121 | Exceptional 98.1% |
| Menominee | 93.9 /100 | #122 | Exceptional 98.1% |
| Iroquois | 93.8 /100 | #123 | Exceptional 98.1% |
| Syrians | 93.7 /100 | #124 | Exceptional 98.1% |
| Immigrants | Japan | 93.7 /100 | #125 | Exceptional 98.1% |
| Lebanese | 93.5 /100 | #126 | Exceptional 98.1% |