Cuban vs Immigrants from Morocco Female Unemployment
COMPARE
Cuban
Immigrants from Morocco
Female Unemployment
Female Unemployment Comparison
Cubans
Immigrants from Morocco
4.9%
FEMALE UNEMPLOYMENT
98.3/ 100
METRIC RATING
67th/ 347
METRIC RANK
5.3%
FEMALE UNEMPLOYMENT
47.4/ 100
METRIC RATING
177th/ 347
METRIC RANK
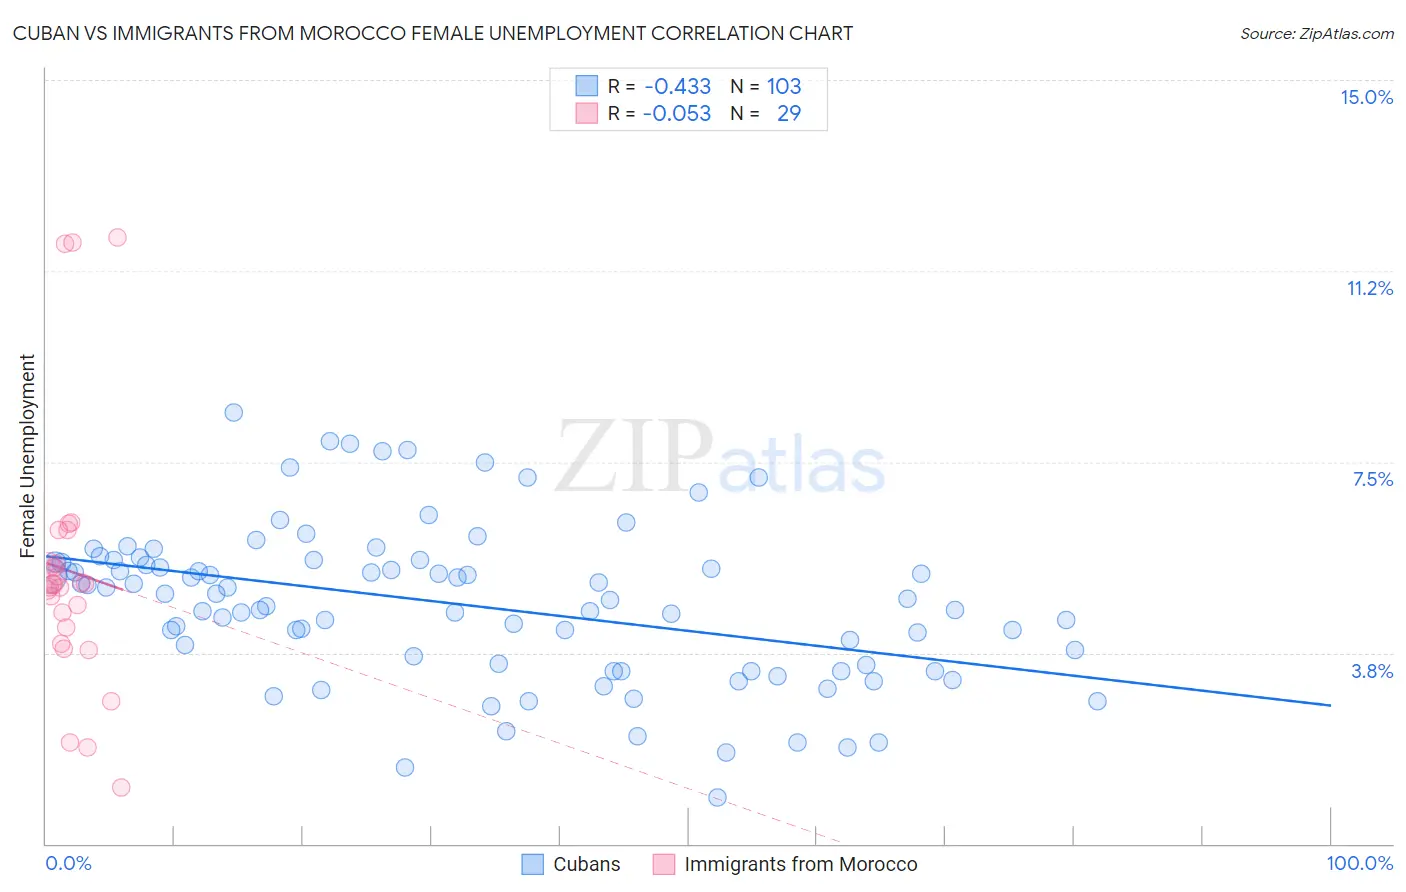
Cuban vs Immigrants from Morocco Female Unemployment Correlation Chart
The statistical analysis conducted on geographies consisting of 446,472,096 people shows a moderate negative correlation between the proportion of Cubans and unemploymnet rate among females in the United States with a correlation coefficient (R) of -0.433 and weighted average of 4.9%. Similarly, the statistical analysis conducted on geographies consisting of 178,730,961 people shows a slight negative correlation between the proportion of Immigrants from Morocco and unemploymnet rate among females in the United States with a correlation coefficient (R) of -0.053 and weighted average of 5.3%, a difference of 6.6%.
Female Unemployment Correlation Summary
| Measurement | Cuban | Immigrants from Morocco |
| Minimum | 0.90% | 1.1% |
| Maximum | 8.5% | 11.9% |
| Range | 7.6% | 10.8% |
| Mean | 4.7% | 5.4% |
| Median | 4.8% | 5.1% |
| Interquartile 25% (IQ1) | 3.5% | 4.1% |
| Interquartile 75% (IQ3) | 5.5% | 5.8% |
| Interquartile Range (IQR) | 2.0% | 1.7% |
| Standard Deviation (Sample) | 1.5% | 2.6% |
| Standard Deviation (Population) | 1.5% | 2.5% |
Similar Demographics by Female Unemployment
Demographics Similar to Cubans by Female Unemployment
In terms of female unemployment, the demographic groups most similar to Cubans are Hungarian (4.9%, a difference of 0.0%), Tlingit-Haida (4.9%, a difference of 0.010%), Immigrants from Ireland (4.9%, a difference of 0.020%), Immigrants from North America (4.9%, a difference of 0.030%), and Osage (4.9%, a difference of 0.060%).
| Demographics | Rating | Rank | Female Unemployment |
| Immigrants | Scotland | 98.6 /100 | #60 | Exceptional 4.9% |
| Immigrants | Canada | 98.6 /100 | #61 | Exceptional 4.9% |
| Immigrants | Nepal | 98.6 /100 | #62 | Exceptional 4.9% |
| Immigrants | Belgium | 98.5 /100 | #63 | Exceptional 4.9% |
| Celtics | 98.5 /100 | #64 | Exceptional 4.9% |
| Immigrants | North America | 98.3 /100 | #65 | Exceptional 4.9% |
| Hungarians | 98.3 /100 | #66 | Exceptional 4.9% |
| Cubans | 98.3 /100 | #67 | Exceptional 4.9% |
| Tlingit-Haida | 98.3 /100 | #68 | Exceptional 4.9% |
| Immigrants | Ireland | 98.2 /100 | #69 | Exceptional 4.9% |
| Osage | 98.2 /100 | #70 | Exceptional 4.9% |
| German Russians | 98.1 /100 | #71 | Exceptional 4.9% |
| Immigrants | Northern Europe | 98.0 /100 | #72 | Exceptional 4.9% |
| Russians | 98.0 /100 | #73 | Exceptional 5.0% |
| Immigrants | Bolivia | 98.0 /100 | #74 | Exceptional 5.0% |
Demographics Similar to Immigrants from Morocco by Female Unemployment
In terms of female unemployment, the demographic groups most similar to Immigrants from Morocco are Immigrants from Vietnam (5.3%, a difference of 0.0%), Immigrants from Laos (5.3%, a difference of 0.010%), Immigrants from Southern Europe (5.3%, a difference of 0.070%), Laotian (5.3%, a difference of 0.14%), and Immigrants from Poland (5.3%, a difference of 0.16%).
| Demographics | Rating | Rank | Female Unemployment |
| Spanish | 55.9 /100 | #170 | Average 5.2% |
| Immigrants | Denmark | 55.0 /100 | #171 | Average 5.2% |
| Immigrants | Uganda | 50.7 /100 | #172 | Average 5.3% |
| Iranians | 50.4 /100 | #173 | Average 5.3% |
| Immigrants | Poland | 50.0 /100 | #174 | Average 5.3% |
| Immigrants | Laos | 47.5 /100 | #175 | Average 5.3% |
| Immigrants | Vietnam | 47.5 /100 | #176 | Average 5.3% |
| Immigrants | Morocco | 47.4 /100 | #177 | Average 5.3% |
| Immigrants | Southern Europe | 46.2 /100 | #178 | Average 5.3% |
| Laotians | 45.1 /100 | #179 | Average 5.3% |
| Immigrants | Congo | 43.1 /100 | #180 | Average 5.3% |
| Taiwanese | 42.7 /100 | #181 | Average 5.3% |
| Immigrants | Nonimmigrants | 42.6 /100 | #182 | Average 5.3% |
| Immigrants | Indonesia | 40.7 /100 | #183 | Average 5.3% |
| Immigrants | Ukraine | 40.1 /100 | #184 | Average 5.3% |