Cuban vs Immigrants from Croatia Female Unemployment
COMPARE
Cuban
Immigrants from Croatia
Female Unemployment
Female Unemployment Comparison
Cubans
Immigrants from Croatia
4.9%
FEMALE UNEMPLOYMENT
98.3/ 100
METRIC RATING
67th/ 347
METRIC RANK
5.1%
FEMALE UNEMPLOYMENT
89.9/ 100
METRIC RATING
118th/ 347
METRIC RANK
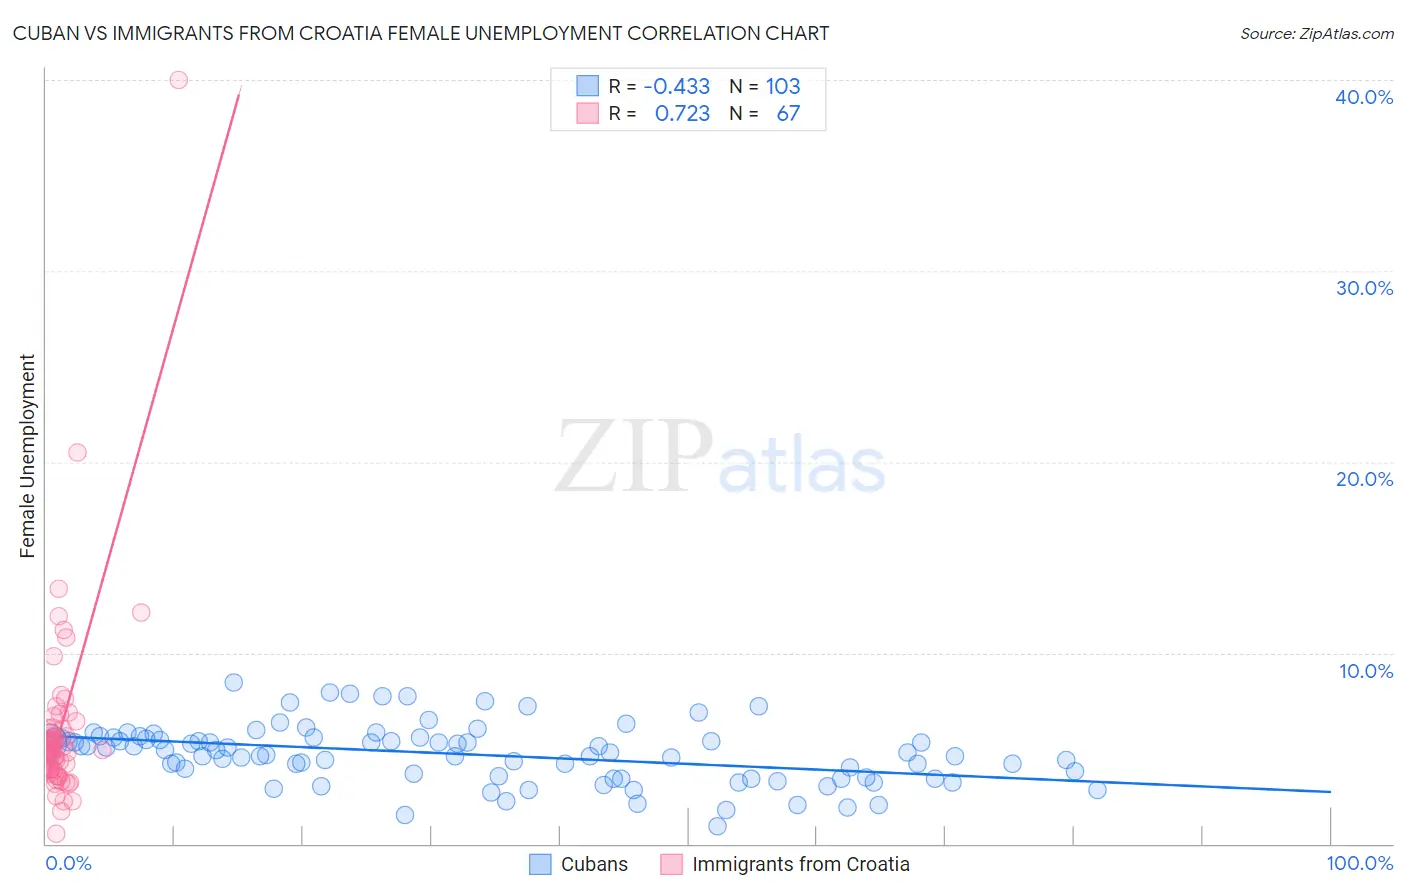
Cuban vs Immigrants from Croatia Female Unemployment Correlation Chart
The statistical analysis conducted on geographies consisting of 446,472,096 people shows a moderate negative correlation between the proportion of Cubans and unemploymnet rate among females in the United States with a correlation coefficient (R) of -0.433 and weighted average of 4.9%. Similarly, the statistical analysis conducted on geographies consisting of 132,440,567 people shows a strong positive correlation between the proportion of Immigrants from Croatia and unemploymnet rate among females in the United States with a correlation coefficient (R) of 0.723 and weighted average of 5.1%, a difference of 2.9%.
Female Unemployment Correlation Summary
| Measurement | Cuban | Immigrants from Croatia |
| Minimum | 0.90% | 0.50% |
| Maximum | 8.5% | 40.0% |
| Range | 7.6% | 39.5% |
| Mean | 4.7% | 6.0% |
| Median | 4.8% | 4.9% |
| Interquartile 25% (IQ1) | 3.5% | 3.9% |
| Interquartile 75% (IQ3) | 5.5% | 6.0% |
| Interquartile Range (IQR) | 2.0% | 2.1% |
| Standard Deviation (Sample) | 1.5% | 5.2% |
| Standard Deviation (Population) | 1.5% | 5.2% |
Similar Demographics by Female Unemployment
Demographics Similar to Cubans by Female Unemployment
In terms of female unemployment, the demographic groups most similar to Cubans are Hungarian (4.9%, a difference of 0.0%), Tlingit-Haida (4.9%, a difference of 0.010%), Immigrants from Ireland (4.9%, a difference of 0.020%), Immigrants from North America (4.9%, a difference of 0.030%), and Osage (4.9%, a difference of 0.060%).
| Demographics | Rating | Rank | Female Unemployment |
| Immigrants | Scotland | 98.6 /100 | #60 | Exceptional 4.9% |
| Immigrants | Canada | 98.6 /100 | #61 | Exceptional 4.9% |
| Immigrants | Nepal | 98.6 /100 | #62 | Exceptional 4.9% |
| Immigrants | Belgium | 98.5 /100 | #63 | Exceptional 4.9% |
| Celtics | 98.5 /100 | #64 | Exceptional 4.9% |
| Immigrants | North America | 98.3 /100 | #65 | Exceptional 4.9% |
| Hungarians | 98.3 /100 | #66 | Exceptional 4.9% |
| Cubans | 98.3 /100 | #67 | Exceptional 4.9% |
| Tlingit-Haida | 98.3 /100 | #68 | Exceptional 4.9% |
| Immigrants | Ireland | 98.2 /100 | #69 | Exceptional 4.9% |
| Osage | 98.2 /100 | #70 | Exceptional 4.9% |
| German Russians | 98.1 /100 | #71 | Exceptional 4.9% |
| Immigrants | Northern Europe | 98.0 /100 | #72 | Exceptional 4.9% |
| Russians | 98.0 /100 | #73 | Exceptional 5.0% |
| Immigrants | Bolivia | 98.0 /100 | #74 | Exceptional 5.0% |
Demographics Similar to Immigrants from Croatia by Female Unemployment
In terms of female unemployment, the demographic groups most similar to Immigrants from Croatia are Jordanian (5.1%, a difference of 0.060%), American (5.1%, a difference of 0.11%), Lebanese (5.1%, a difference of 0.18%), Immigrants from Turkey (5.1%, a difference of 0.20%), and Immigrants from Saudi Arabia (5.1%, a difference of 0.24%).
| Demographics | Rating | Rank | Female Unemployment |
| Immigrants | Burma/Myanmar | 92.3 /100 | #111 | Exceptional 5.1% |
| Estonians | 92.1 /100 | #112 | Exceptional 5.1% |
| Immigrants | Saudi Arabia | 91.2 /100 | #113 | Exceptional 5.1% |
| Immigrants | Turkey | 91.0 /100 | #114 | Exceptional 5.1% |
| Lebanese | 91.0 /100 | #115 | Exceptional 5.1% |
| Americans | 90.5 /100 | #116 | Exceptional 5.1% |
| Jordanians | 90.3 /100 | #117 | Exceptional 5.1% |
| Immigrants | Croatia | 89.9 /100 | #118 | Excellent 5.1% |
| Immigrants | North Macedonia | 88.3 /100 | #119 | Excellent 5.1% |
| Immigrants | Romania | 88.1 /100 | #120 | Excellent 5.1% |
| Immigrants | Western Europe | 88.1 /100 | #121 | Excellent 5.1% |
| Immigrants | Germany | 87.6 /100 | #122 | Excellent 5.1% |
| Immigrants | South Africa | 87.6 /100 | #123 | Excellent 5.1% |
| Immigrants | Europe | 87.2 /100 | #124 | Excellent 5.1% |
| Basques | 86.5 /100 | #125 | Excellent 5.1% |