Argentinean vs Immigrants from Latin America Female Unemployment
COMPARE
Argentinean
Immigrants from Latin America
Female Unemployment
Female Unemployment Comparison
Argentineans
Immigrants from Latin America
5.2%
FEMALE UNEMPLOYMENT
79.2/ 100
METRIC RATING
147th/ 347
METRIC RANK
6.1%
FEMALE UNEMPLOYMENT
0.0/ 100
METRIC RATING
295th/ 347
METRIC RANK
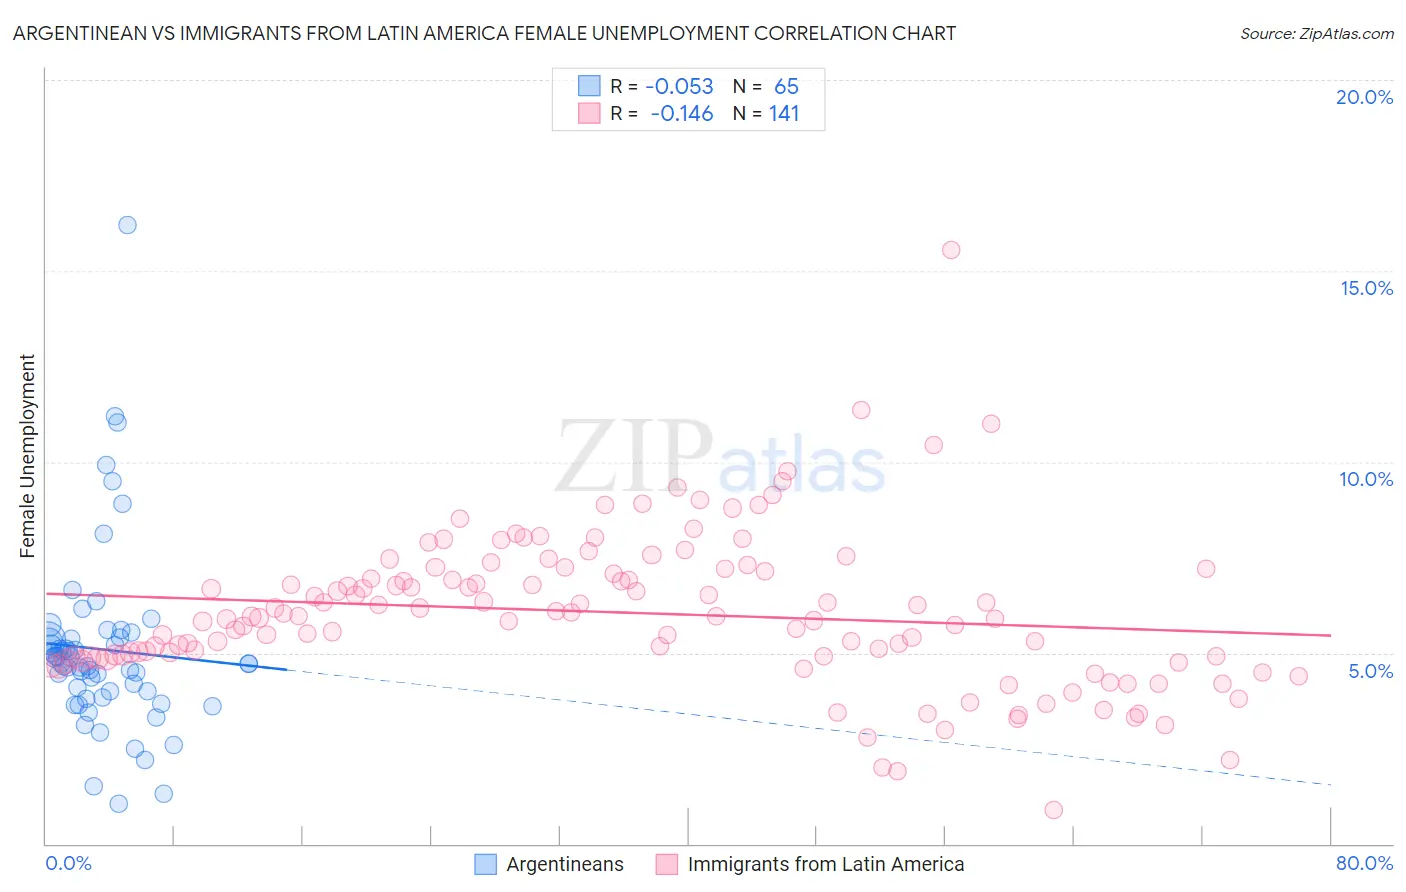
Argentinean vs Immigrants from Latin America Female Unemployment Correlation Chart
The statistical analysis conducted on geographies consisting of 296,580,968 people shows a slight negative correlation between the proportion of Argentineans and unemploymnet rate among females in the United States with a correlation coefficient (R) of -0.053 and weighted average of 5.2%. Similarly, the statistical analysis conducted on geographies consisting of 548,551,926 people shows a poor negative correlation between the proportion of Immigrants from Latin America and unemploymnet rate among females in the United States with a correlation coefficient (R) of -0.146 and weighted average of 6.1%, a difference of 18.8%.
Female Unemployment Correlation Summary
| Measurement | Argentinean | Immigrants from Latin America |
| Minimum | 1.0% | 0.90% |
| Maximum | 16.2% | 15.5% |
| Range | 15.2% | 14.6% |
| Mean | 5.1% | 6.1% |
| Median | 4.7% | 6.0% |
| Interquartile 25% (IQ1) | 3.9% | 4.9% |
| Interquartile 75% (IQ3) | 5.4% | 7.2% |
| Interquartile Range (IQR) | 1.5% | 2.3% |
| Standard Deviation (Sample) | 2.4% | 2.0% |
| Standard Deviation (Population) | 2.4% | 2.0% |
Similar Demographics by Female Unemployment
Demographics Similar to Argentineans by Female Unemployment
In terms of female unemployment, the demographic groups most similar to Argentineans are Immigrants from Norway (5.2%, a difference of 0.020%), Immigrants from Oceania (5.2%, a difference of 0.030%), Immigrants from Argentina (5.2%, a difference of 0.050%), Asian (5.2%, a difference of 0.080%), and Egyptian (5.2%, a difference of 0.080%).
| Demographics | Rating | Rank | Female Unemployment |
| Immigrants | France | 82.7 /100 | #140 | Excellent 5.1% |
| Immigrants | Eastern Europe | 81.5 /100 | #141 | Excellent 5.1% |
| Palestinians | 80.8 /100 | #142 | Excellent 5.1% |
| Immigrants | Kazakhstan | 80.7 /100 | #143 | Excellent 5.1% |
| Immigrants | Jordan | 80.4 /100 | #144 | Excellent 5.1% |
| Immigrants | Oceania | 79.5 /100 | #145 | Good 5.2% |
| Immigrants | Norway | 79.4 /100 | #146 | Good 5.2% |
| Argentineans | 79.2 /100 | #147 | Good 5.2% |
| Immigrants | Argentina | 78.7 /100 | #148 | Good 5.2% |
| Asians | 78.3 /100 | #149 | Good 5.2% |
| Egyptians | 78.3 /100 | #150 | Good 5.2% |
| Immigrants | China | 75.9 /100 | #151 | Good 5.2% |
| Immigrants | Italy | 75.0 /100 | #152 | Good 5.2% |
| Immigrants | Greece | 74.9 /100 | #153 | Good 5.2% |
| South Africans | 70.8 /100 | #154 | Good 5.2% |
Demographics Similar to Immigrants from Latin America by Female Unemployment
In terms of female unemployment, the demographic groups most similar to Immigrants from Latin America are Alaskan Athabascan (6.1%, a difference of 0.020%), West Indian (6.1%, a difference of 0.030%), Jamaican (6.1%, a difference of 0.050%), Immigrants from El Salvador (6.1%, a difference of 0.10%), and Ute (6.1%, a difference of 0.16%).
| Demographics | Rating | Rank | Female Unemployment |
| Haitians | 0.0 /100 | #288 | Tragic 6.1% |
| Trinidadians and Tobagonians | 0.0 /100 | #289 | Tragic 6.1% |
| Immigrants | Caribbean | 0.0 /100 | #290 | Tragic 6.1% |
| Immigrants | West Indies | 0.0 /100 | #291 | Tragic 6.1% |
| Immigrants | Trinidad and Tobago | 0.0 /100 | #292 | Tragic 6.1% |
| Mexicans | 0.0 /100 | #293 | Tragic 6.1% |
| Immigrants | El Salvador | 0.0 /100 | #294 | Tragic 6.1% |
| Immigrants | Latin America | 0.0 /100 | #295 | Tragic 6.1% |
| Alaskan Athabascans | 0.0 /100 | #296 | Tragic 6.1% |
| West Indians | 0.0 /100 | #297 | Tragic 6.1% |
| Jamaicans | 0.0 /100 | #298 | Tragic 6.1% |
| Ute | 0.0 /100 | #299 | Tragic 6.1% |
| Immigrants | Haiti | 0.0 /100 | #300 | Tragic 6.1% |
| Immigrants | Barbados | 0.0 /100 | #301 | Tragic 6.2% |
| U.S. Virgin Islanders | 0.0 /100 | #302 | Tragic 6.2% |