Creek vs Immigrants from Lithuania Female Unemployment
COMPARE
Creek
Immigrants from Lithuania
Female Unemployment
Female Unemployment Comparison
Creek
Immigrants from Lithuania
5.4%
FEMALE UNEMPLOYMENT
15.4/ 100
METRIC RATING
207th/ 347
METRIC RANK
4.9%
FEMALE UNEMPLOYMENT
98.8/ 100
METRIC RATING
58th/ 347
METRIC RANK
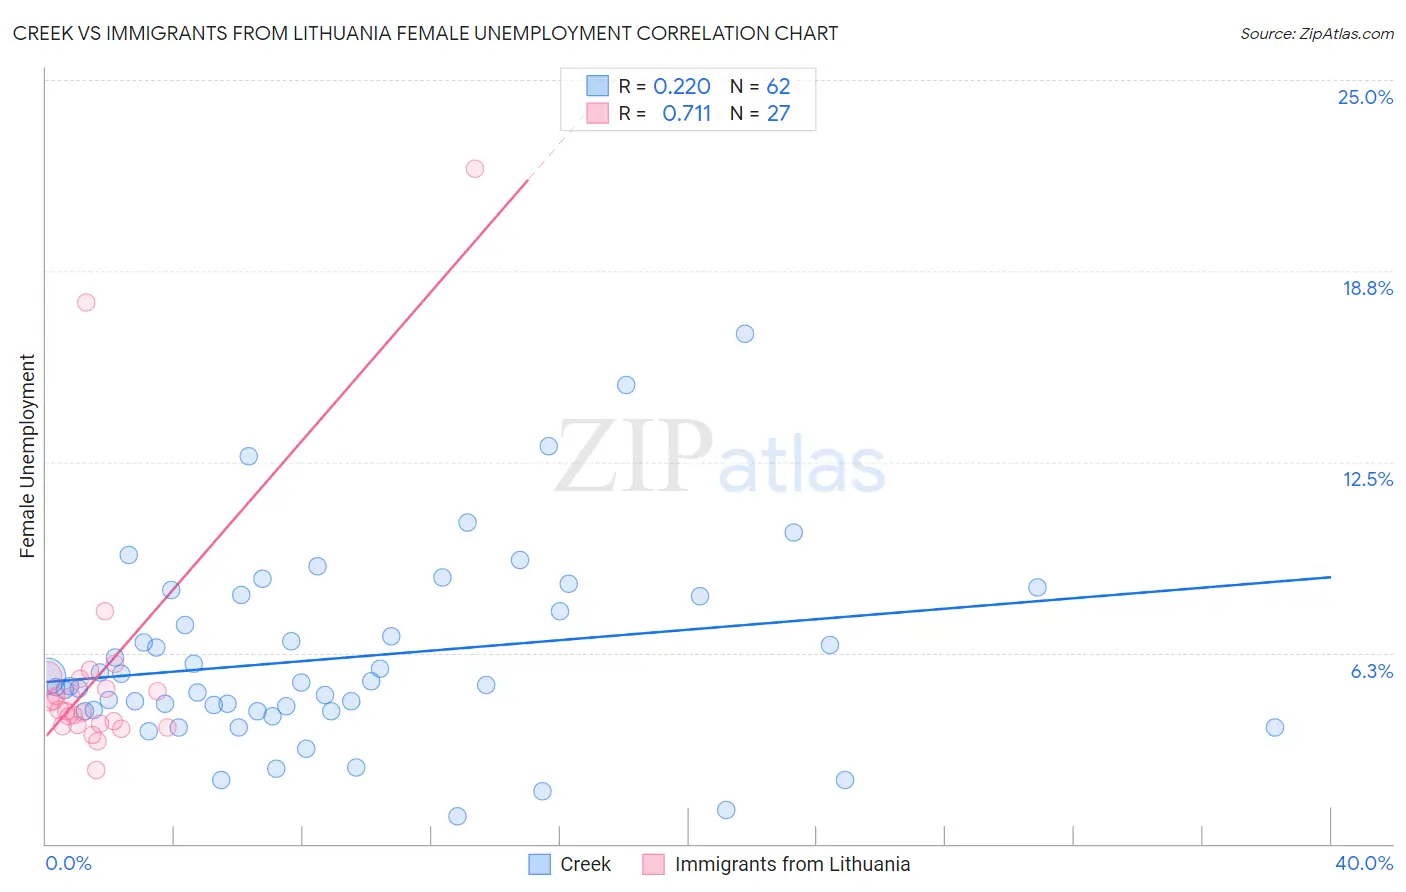
Creek vs Immigrants from Lithuania Female Unemployment Correlation Chart
The statistical analysis conducted on geographies consisting of 177,704,441 people shows a weak positive correlation between the proportion of Creek and unemploymnet rate among females in the United States with a correlation coefficient (R) of 0.220 and weighted average of 5.4%. Similarly, the statistical analysis conducted on geographies consisting of 117,604,968 people shows a strong positive correlation between the proportion of Immigrants from Lithuania and unemploymnet rate among females in the United States with a correlation coefficient (R) of 0.711 and weighted average of 4.9%, a difference of 9.8%.
Female Unemployment Correlation Summary
| Measurement | Creek | Immigrants from Lithuania |
| Minimum | 0.90% | 2.4% |
| Maximum | 16.7% | 22.1% |
| Range | 15.8% | 19.7% |
| Mean | 6.1% | 5.7% |
| Median | 5.2% | 4.4% |
| Interquartile 25% (IQ1) | 4.3% | 3.9% |
| Interquartile 75% (IQ3) | 8.1% | 5.4% |
| Interquartile Range (IQR) | 3.8% | 1.5% |
| Standard Deviation (Sample) | 3.1% | 4.3% |
| Standard Deviation (Population) | 3.1% | 4.2% |
Similar Demographics by Female Unemployment
Demographics Similar to Creek by Female Unemployment
In terms of female unemployment, the demographic groups most similar to Creek are Immigrants from Costa Rica (5.4%, a difference of 0.19%), Korean (5.4%, a difference of 0.24%), Immigrants from Brazil (5.4%, a difference of 0.35%), Immigrants from Afghanistan (5.4%, a difference of 0.37%), and Choctaw (5.4%, a difference of 0.38%).
| Demographics | Rating | Rank | Female Unemployment |
| Soviet Union | 21.7 /100 | #200 | Fair 5.4% |
| Immigrants | Middle Africa | 20.8 /100 | #201 | Fair 5.4% |
| Iroquois | 20.8 /100 | #202 | Fair 5.4% |
| Immigrants | South Eastern Asia | 20.3 /100 | #203 | Fair 5.4% |
| Immigrants | Israel | 19.7 /100 | #204 | Poor 5.4% |
| Immigrants | Afghanistan | 18.9 /100 | #205 | Poor 5.4% |
| Immigrants | Brazil | 18.8 /100 | #206 | Poor 5.4% |
| Creek | 15.4 /100 | #207 | Poor 5.4% |
| Immigrants | Costa Rica | 13.7 /100 | #208 | Poor 5.4% |
| Koreans | 13.4 /100 | #209 | Poor 5.4% |
| Choctaw | 12.3 /100 | #210 | Poor 5.4% |
| Ottawa | 11.6 /100 | #211 | Poor 5.4% |
| Uruguayans | 11.4 /100 | #212 | Poor 5.4% |
| Samoans | 10.6 /100 | #213 | Poor 5.4% |
| Seminole | 10.3 /100 | #214 | Poor 5.4% |
Demographics Similar to Immigrants from Lithuania by Female Unemployment
In terms of female unemployment, the demographic groups most similar to Immigrants from Lithuania are Icelander (4.9%, a difference of 0.090%), Bhutanese (4.9%, a difference of 0.12%), Immigrants from Scotland (4.9%, a difference of 0.20%), Immigrants from Canada (4.9%, a difference of 0.20%), and Immigrants from Nepal (4.9%, a difference of 0.21%).
| Demographics | Rating | Rank | Female Unemployment |
| Cambodians | 99.1 /100 | #51 | Exceptional 4.9% |
| Slavs | 99.1 /100 | #52 | Exceptional 4.9% |
| Whites/Caucasians | 99.0 /100 | #53 | Exceptional 4.9% |
| Immigrants | Zimbabwe | 99.0 /100 | #54 | Exceptional 4.9% |
| Immigrants | Moldova | 99.0 /100 | #55 | Exceptional 4.9% |
| Serbians | 99.0 /100 | #56 | Exceptional 4.9% |
| Icelanders | 98.8 /100 | #57 | Exceptional 4.9% |
| Immigrants | Lithuania | 98.8 /100 | #58 | Exceptional 4.9% |
| Bhutanese | 98.7 /100 | #59 | Exceptional 4.9% |
| Immigrants | Scotland | 98.6 /100 | #60 | Exceptional 4.9% |
| Immigrants | Canada | 98.6 /100 | #61 | Exceptional 4.9% |
| Immigrants | Nepal | 98.6 /100 | #62 | Exceptional 4.9% |
| Immigrants | Belgium | 98.5 /100 | #63 | Exceptional 4.9% |
| Celtics | 98.5 /100 | #64 | Exceptional 4.9% |
| Immigrants | North America | 98.3 /100 | #65 | Exceptional 4.9% |