Creek vs Immigrants from Bolivia Female Unemployment
COMPARE
Creek
Immigrants from Bolivia
Female Unemployment
Female Unemployment Comparison
Creek
Immigrants from Bolivia
5.4%
FEMALE UNEMPLOYMENT
15.4/ 100
METRIC RATING
207th/ 347
METRIC RANK
5.0%
FEMALE UNEMPLOYMENT
98.0/ 100
METRIC RATING
74th/ 347
METRIC RANK
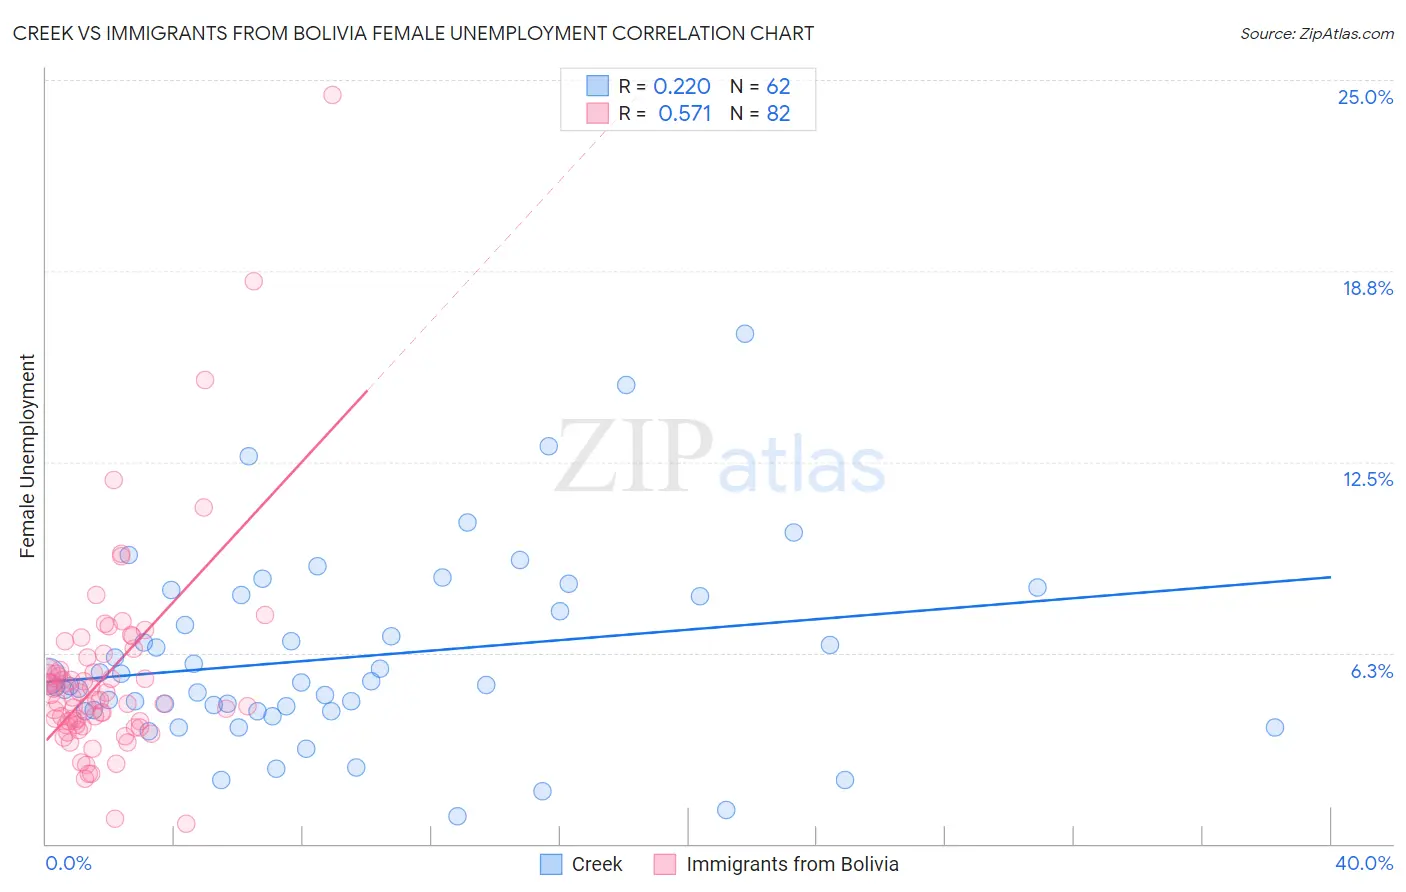
Creek vs Immigrants from Bolivia Female Unemployment Correlation Chart
The statistical analysis conducted on geographies consisting of 177,704,441 people shows a weak positive correlation between the proportion of Creek and unemploymnet rate among females in the United States with a correlation coefficient (R) of 0.220 and weighted average of 5.4%. Similarly, the statistical analysis conducted on geographies consisting of 158,575,090 people shows a substantial positive correlation between the proportion of Immigrants from Bolivia and unemploymnet rate among females in the United States with a correlation coefficient (R) of 0.571 and weighted average of 5.0%, a difference of 8.9%.
Female Unemployment Correlation Summary
| Measurement | Creek | Immigrants from Bolivia |
| Minimum | 0.90% | 0.67% |
| Maximum | 16.7% | 24.5% |
| Range | 15.8% | 23.8% |
| Mean | 6.1% | 5.5% |
| Median | 5.2% | 4.8% |
| Interquartile 25% (IQ1) | 4.3% | 3.9% |
| Interquartile 75% (IQ3) | 8.1% | 5.7% |
| Interquartile Range (IQR) | 3.8% | 1.8% |
| Standard Deviation (Sample) | 3.1% | 3.4% |
| Standard Deviation (Population) | 3.1% | 3.4% |
Similar Demographics by Female Unemployment
Demographics Similar to Creek by Female Unemployment
In terms of female unemployment, the demographic groups most similar to Creek are Immigrants from Costa Rica (5.4%, a difference of 0.19%), Korean (5.4%, a difference of 0.24%), Immigrants from Brazil (5.4%, a difference of 0.35%), Immigrants from Afghanistan (5.4%, a difference of 0.37%), and Choctaw (5.4%, a difference of 0.38%).
| Demographics | Rating | Rank | Female Unemployment |
| Soviet Union | 21.7 /100 | #200 | Fair 5.4% |
| Immigrants | Middle Africa | 20.8 /100 | #201 | Fair 5.4% |
| Iroquois | 20.8 /100 | #202 | Fair 5.4% |
| Immigrants | South Eastern Asia | 20.3 /100 | #203 | Fair 5.4% |
| Immigrants | Israel | 19.7 /100 | #204 | Poor 5.4% |
| Immigrants | Afghanistan | 18.9 /100 | #205 | Poor 5.4% |
| Immigrants | Brazil | 18.8 /100 | #206 | Poor 5.4% |
| Creek | 15.4 /100 | #207 | Poor 5.4% |
| Immigrants | Costa Rica | 13.7 /100 | #208 | Poor 5.4% |
| Koreans | 13.4 /100 | #209 | Poor 5.4% |
| Choctaw | 12.3 /100 | #210 | Poor 5.4% |
| Ottawa | 11.6 /100 | #211 | Poor 5.4% |
| Uruguayans | 11.4 /100 | #212 | Poor 5.4% |
| Samoans | 10.6 /100 | #213 | Poor 5.4% |
| Seminole | 10.3 /100 | #214 | Poor 5.4% |
Demographics Similar to Immigrants from Bolivia by Female Unemployment
In terms of female unemployment, the demographic groups most similar to Immigrants from Bolivia are Russian (5.0%, a difference of 0.010%), Immigrants from Singapore (5.0%, a difference of 0.020%), Immigrants from Venezuela (5.0%, a difference of 0.030%), Immigrants from Northern Europe (4.9%, a difference of 0.040%), and German Russian (4.9%, a difference of 0.11%).
| Demographics | Rating | Rank | Female Unemployment |
| Cubans | 98.3 /100 | #67 | Exceptional 4.9% |
| Tlingit-Haida | 98.3 /100 | #68 | Exceptional 4.9% |
| Immigrants | Ireland | 98.2 /100 | #69 | Exceptional 4.9% |
| Osage | 98.2 /100 | #70 | Exceptional 4.9% |
| German Russians | 98.1 /100 | #71 | Exceptional 4.9% |
| Immigrants | Northern Europe | 98.0 /100 | #72 | Exceptional 4.9% |
| Russians | 98.0 /100 | #73 | Exceptional 5.0% |
| Immigrants | Bolivia | 98.0 /100 | #74 | Exceptional 5.0% |
| Immigrants | Singapore | 98.0 /100 | #75 | Exceptional 5.0% |
| Immigrants | Venezuela | 97.9 /100 | #76 | Exceptional 5.0% |
| Mongolians | 97.8 /100 | #77 | Exceptional 5.0% |
| Immigrants | Netherlands | 97.8 /100 | #78 | Exceptional 5.0% |
| Turks | 97.6 /100 | #79 | Exceptional 5.0% |
| New Zealanders | 97.4 /100 | #80 | Exceptional 5.0% |
| Filipinos | 97.3 /100 | #81 | Exceptional 5.0% |