Creek vs Immigrants from Lithuania 9th Grade
COMPARE
Creek
Immigrants from Lithuania
9th Grade
9th Grade Comparison
Creek
Immigrants from Lithuania
95.6%
9TH GRADE
98.8/ 100
METRIC RATING
91st/ 347
METRIC RANK
95.8%
9TH GRADE
99.6/ 100
METRIC RATING
69th/ 347
METRIC RANK
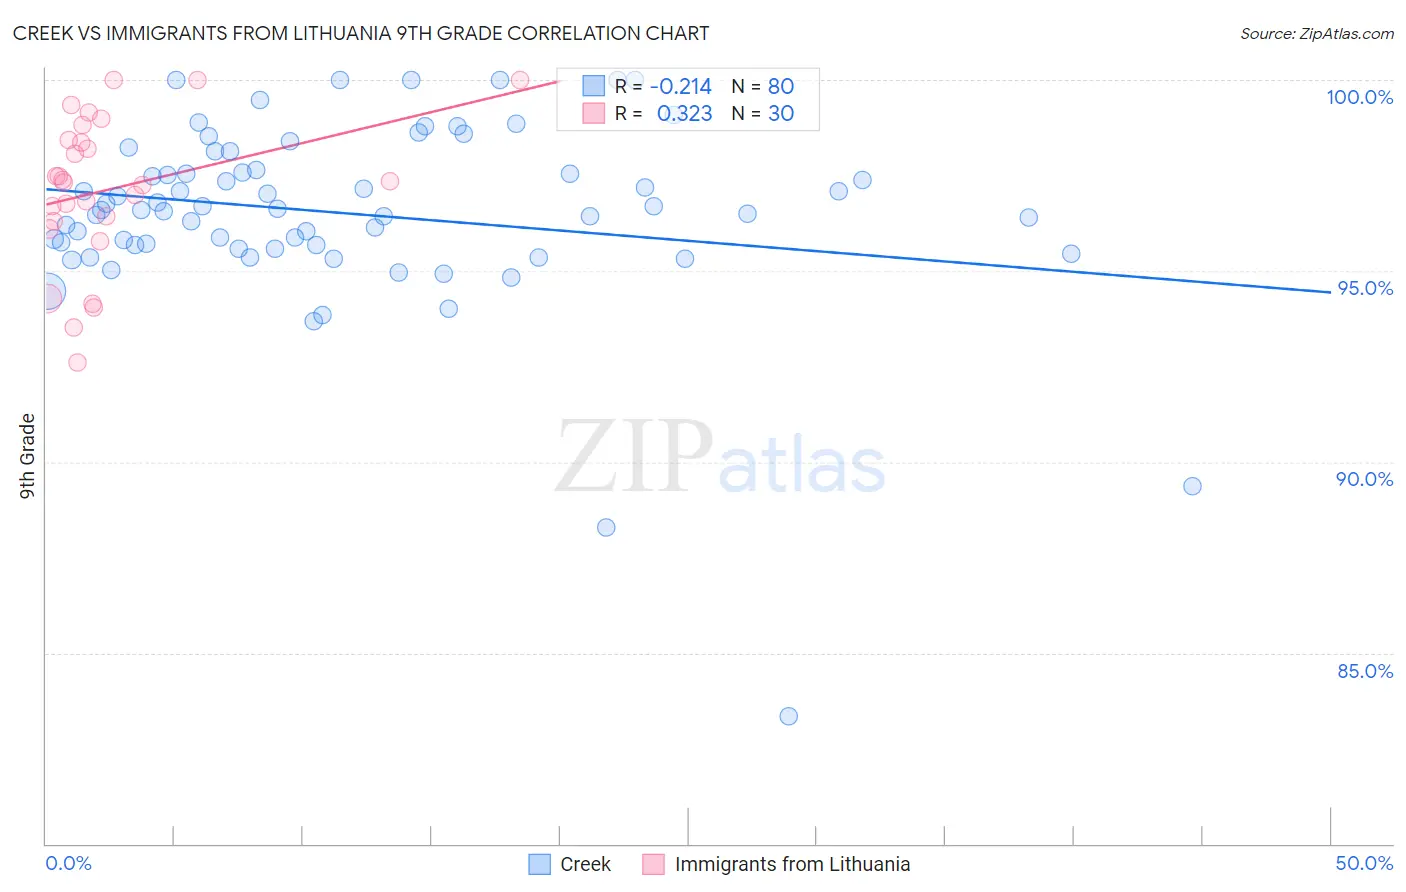
Creek vs Immigrants from Lithuania 9th Grade Correlation Chart
The statistical analysis conducted on geographies consisting of 178,480,629 people shows a weak negative correlation between the proportion of Creek and percentage of population with at least 9th grade education in the United States with a correlation coefficient (R) of -0.214 and weighted average of 95.6%. Similarly, the statistical analysis conducted on geographies consisting of 117,724,932 people shows a mild positive correlation between the proportion of Immigrants from Lithuania and percentage of population with at least 9th grade education in the United States with a correlation coefficient (R) of 0.323 and weighted average of 95.8%, a difference of 0.20%.
9th Grade Correlation Summary
| Measurement | Creek | Immigrants from Lithuania |
| Minimum | 83.3% | 92.6% |
| Maximum | 100.0% | 100.0% |
| Range | 16.7% | 7.4% |
| Mean | 96.5% | 97.1% |
| Median | 96.6% | 97.3% |
| Interquartile 25% (IQ1) | 95.6% | 96.3% |
| Interquartile 75% (IQ3) | 97.6% | 98.4% |
| Interquartile Range (IQR) | 2.0% | 2.1% |
| Standard Deviation (Sample) | 2.5% | 2.0% |
| Standard Deviation (Population) | 2.5% | 1.9% |
Similar Demographics by 9th Grade
Demographics Similar to Creek by 9th Grade
In terms of 9th grade, the demographic groups most similar to Creek are Immigrants from Saudi Arabia (95.6%, a difference of 0.0%), Yugoslavian (95.7%, a difference of 0.010%), South African (95.6%, a difference of 0.010%), Immigrants from Germany (95.6%, a difference of 0.010%), and Immigrants from Latvia (95.6%, a difference of 0.010%).
| Demographics | Rating | Rank | 9th Grade |
| Immigrants | Denmark | 99.1 /100 | #84 | Exceptional 95.7% |
| Icelanders | 99.1 /100 | #85 | Exceptional 95.7% |
| Immigrants | Western Europe | 99.1 /100 | #86 | Exceptional 95.7% |
| Okinawans | 99.0 /100 | #87 | Exceptional 95.7% |
| Immigrants | Czechoslovakia | 98.9 /100 | #88 | Exceptional 95.7% |
| Yugoslavians | 98.9 /100 | #89 | Exceptional 95.7% |
| South Africans | 98.8 /100 | #90 | Exceptional 95.6% |
| Creek | 98.8 /100 | #91 | Exceptional 95.6% |
| Immigrants | Saudi Arabia | 98.8 /100 | #92 | Exceptional 95.6% |
| Immigrants | Germany | 98.7 /100 | #93 | Exceptional 95.6% |
| Immigrants | Latvia | 98.7 /100 | #94 | Exceptional 95.6% |
| Americans | 98.5 /100 | #95 | Exceptional 95.6% |
| Filipinos | 98.5 /100 | #96 | Exceptional 95.6% |
| Delaware | 98.4 /100 | #97 | Exceptional 95.6% |
| Immigrants | Japan | 98.4 /100 | #98 | Exceptional 95.6% |
Demographics Similar to Immigrants from Lithuania by 9th Grade
In terms of 9th grade, the demographic groups most similar to Immigrants from Lithuania are Cypriot (95.8%, a difference of 0.0%), Immigrants from Ireland (95.8%, a difference of 0.0%), Immigrants from Netherlands (95.8%, a difference of 0.010%), Immigrants from Australia (95.8%, a difference of 0.020%), and Immigrants from Belgium (95.8%, a difference of 0.020%).
| Demographics | Rating | Rank | 9th Grade |
| Ukrainians | 99.7 /100 | #62 | Exceptional 95.9% |
| Canadians | 99.7 /100 | #63 | Exceptional 95.9% |
| Zimbabweans | 99.7 /100 | #64 | Exceptional 95.9% |
| Immigrants | England | 99.6 /100 | #65 | Exceptional 95.9% |
| Immigrants | Netherlands | 99.6 /100 | #66 | Exceptional 95.8% |
| Cypriots | 99.6 /100 | #67 | Exceptional 95.8% |
| Immigrants | Ireland | 99.6 /100 | #68 | Exceptional 95.8% |
| Immigrants | Lithuania | 99.6 /100 | #69 | Exceptional 95.8% |
| Immigrants | Australia | 99.5 /100 | #70 | Exceptional 95.8% |
| Immigrants | Belgium | 99.5 /100 | #71 | Exceptional 95.8% |
| Turks | 99.5 /100 | #72 | Exceptional 95.8% |
| Immigrants | Singapore | 99.5 /100 | #73 | Exceptional 95.8% |
| Thais | 99.5 /100 | #74 | Exceptional 95.8% |
| Inupiat | 99.5 /100 | #75 | Exceptional 95.8% |
| Immigrants | Sweden | 99.5 /100 | #76 | Exceptional 95.8% |