Creek vs Immigrants from the Azores Female Unemployment
COMPARE
Creek
Immigrants from the Azores
Female Unemployment
Female Unemployment Comparison
Creek
Immigrants from the Azores
5.4%
FEMALE UNEMPLOYMENT
15.4/ 100
METRIC RATING
207th/ 347
METRIC RANK
5.8%
FEMALE UNEMPLOYMENT
0.1/ 100
METRIC RATING
263rd/ 347
METRIC RANK
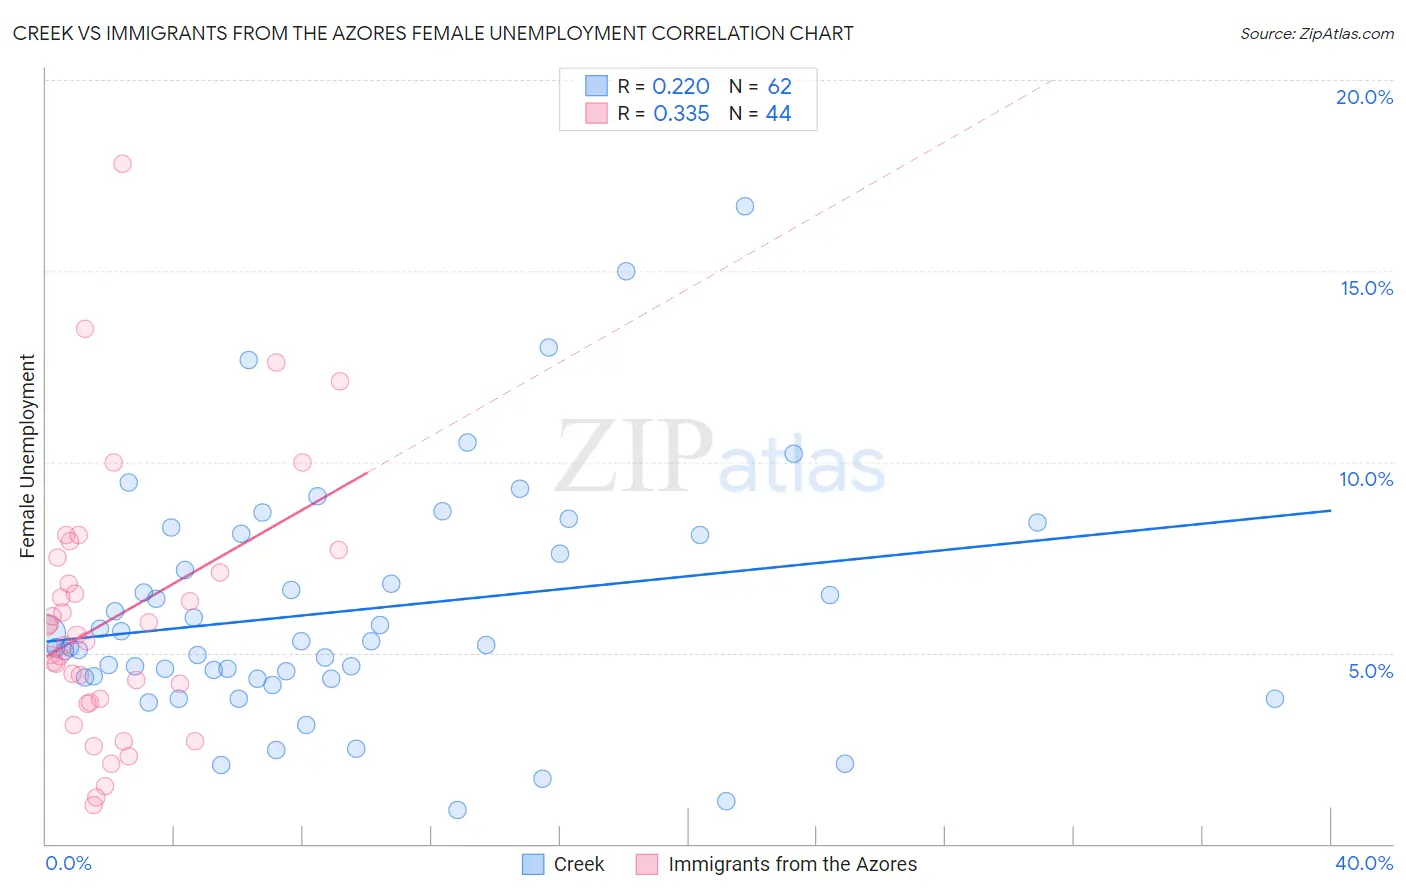
Creek vs Immigrants from the Azores Female Unemployment Correlation Chart
The statistical analysis conducted on geographies consisting of 177,704,441 people shows a weak positive correlation between the proportion of Creek and unemploymnet rate among females in the United States with a correlation coefficient (R) of 0.220 and weighted average of 5.4%. Similarly, the statistical analysis conducted on geographies consisting of 46,148,620 people shows a mild positive correlation between the proportion of Immigrants from the Azores and unemploymnet rate among females in the United States with a correlation coefficient (R) of 0.335 and weighted average of 5.8%, a difference of 7.9%.
Female Unemployment Correlation Summary
| Measurement | Creek | Immigrants from the Azores |
| Minimum | 0.90% | 1.0% |
| Maximum | 16.7% | 17.8% |
| Range | 15.8% | 16.8% |
| Mean | 6.1% | 5.9% |
| Median | 5.2% | 5.4% |
| Interquartile 25% (IQ1) | 4.3% | 3.7% |
| Interquartile 75% (IQ3) | 8.1% | 7.3% |
| Interquartile Range (IQR) | 3.8% | 3.6% |
| Standard Deviation (Sample) | 3.1% | 3.4% |
| Standard Deviation (Population) | 3.1% | 3.4% |
Similar Demographics by Female Unemployment
Demographics Similar to Creek by Female Unemployment
In terms of female unemployment, the demographic groups most similar to Creek are Immigrants from Costa Rica (5.4%, a difference of 0.19%), Korean (5.4%, a difference of 0.24%), Immigrants from Brazil (5.4%, a difference of 0.35%), Immigrants from Afghanistan (5.4%, a difference of 0.37%), and Choctaw (5.4%, a difference of 0.38%).
| Demographics | Rating | Rank | Female Unemployment |
| Soviet Union | 21.7 /100 | #200 | Fair 5.4% |
| Immigrants | Middle Africa | 20.8 /100 | #201 | Fair 5.4% |
| Iroquois | 20.8 /100 | #202 | Fair 5.4% |
| Immigrants | South Eastern Asia | 20.3 /100 | #203 | Fair 5.4% |
| Immigrants | Israel | 19.7 /100 | #204 | Poor 5.4% |
| Immigrants | Afghanistan | 18.9 /100 | #205 | Poor 5.4% |
| Immigrants | Brazil | 18.8 /100 | #206 | Poor 5.4% |
| Creek | 15.4 /100 | #207 | Poor 5.4% |
| Immigrants | Costa Rica | 13.7 /100 | #208 | Poor 5.4% |
| Koreans | 13.4 /100 | #209 | Poor 5.4% |
| Choctaw | 12.3 /100 | #210 | Poor 5.4% |
| Ottawa | 11.6 /100 | #211 | Poor 5.4% |
| Uruguayans | 11.4 /100 | #212 | Poor 5.4% |
| Samoans | 10.6 /100 | #213 | Poor 5.4% |
| Seminole | 10.3 /100 | #214 | Poor 5.4% |
Demographics Similar to Immigrants from the Azores by Female Unemployment
In terms of female unemployment, the demographic groups most similar to Immigrants from the Azores are Immigrants from Bahamas (5.8%, a difference of 0.39%), Immigrants from Nigeria (5.8%, a difference of 0.67%), Kiowa (5.8%, a difference of 0.71%), Blackfeet (5.9%, a difference of 0.79%), and Nigerian (5.8%, a difference of 0.97%).
| Demographics | Rating | Rank | Female Unemployment |
| Sub-Saharan Africans | 0.4 /100 | #256 | Tragic 5.7% |
| Dutch West Indians | 0.3 /100 | #257 | Tragic 5.7% |
| Immigrants | Portugal | 0.2 /100 | #258 | Tragic 5.8% |
| Immigrants | Fiji | 0.2 /100 | #259 | Tragic 5.8% |
| Nigerians | 0.2 /100 | #260 | Tragic 5.8% |
| Kiowa | 0.1 /100 | #261 | Tragic 5.8% |
| Immigrants | Nigeria | 0.1 /100 | #262 | Tragic 5.8% |
| Immigrants | Azores | 0.1 /100 | #263 | Tragic 5.8% |
| Immigrants | Bahamas | 0.1 /100 | #264 | Tragic 5.8% |
| Blackfeet | 0.0 /100 | #265 | Tragic 5.9% |
| Cape Verdeans | 0.0 /100 | #266 | Tragic 5.9% |
| Nepalese | 0.0 /100 | #267 | Tragic 5.9% |
| Hondurans | 0.0 /100 | #268 | Tragic 5.9% |
| Immigrants | Western Africa | 0.0 /100 | #269 | Tragic 5.9% |
| Immigrants | Honduras | 0.0 /100 | #270 | Tragic 5.9% |