Australian vs Immigrants from the Azores Female Unemployment

COMPARE

Australian
Race
Ancestry
AfghanAfricanAlaska NativeAlaskan AthabascanAlbanianAleutAlsatianAmericanApacheArabArapahoArgentineanArmenianAssyrian/Chaldean/SyriacAustralianAustrianBahamianBangladeshiBarbadianBasqueBelgianBelizeanBermudanBhutaneseBlackfeetBolivianBrazilianBritishBritish West IndianBulgarianBurmeseCajunCambodianCanadianCape VerdeanCarpatho RusynCelticCentral AmericanCentral American IndianCherokeeCheyenneChickasawChileanChineseChippewaChoctawColombianColvilleComancheCosta RicanCreeCreekCroatianCrowCubanCypriotCzechCzechoslovakianDanishDelawareDominicanDutchDutch West IndianEastern EuropeanEcuadorianEgyptianEnglishEstonianEthiopianEuropeanFijianFilipinoFinnishFrenchFrench American IndianFrench CanadianGermanGerman RussianGhanaianGreekGuamanian/ChamorroGuatemalanGuyaneseHaitianHmongHonduranHopiHoumaHungarianIcelanderIndian (Asian)IndonesianInupiatIranianIraqiIrishIroquoisIsraeliItalianJamaicanJapaneseJordanianKenyanKiowaKoreanLaotianLatvianLebaneseLiberianLithuanianLumbeeLuxembourgerMacedonianMalaysianMalteseMarshalleseMenomineeMexicanMexican American IndianMongolianMoroccanNative HawaiianNavajoNepaleseNew ZealanderNicaraguanNigerianNorthern EuropeanNorwegianOkinawanOsageOttawaPaiutePakistaniPalestinianPanamanianParaguayanPennsylvania GermanPeruvianPimaPolishPortuguesePotawatomiPuebloPuerto RicanPuget Sound SalishRomanianRussianSalvadoranSamoanScandinavianScotch-IrishScottishSeminoleSenegaleseSerbianShoshoneSierra LeoneanSiouxSlavicSlovakSloveneSomaliSouth AfricanSouth AmericanSouth American IndianSoviet UnionSpaniardSpanishSpanish AmericanSpanish American IndianSri LankanSubsaharan AfricanSudaneseSwedishSwissSyrianTaiwaneseThaiTlingit-HaidaTohono O'OdhamTonganTrinidadian and TobagonianTsimshianTurkishU.S. Virgin IslanderUgandanUkrainianUruguayanUteVenezuelanVietnameseWelshWest IndianYakamaYaquiYugoslavianYumanYup'ikZimbabwean
Immigration
NonimmigrantsImmigrantsAfghanistanAfricaAlbaniaArgentinaArmeniaAsiaAustraliaAustriaBahamasBangladeshBarbadosBelarusBelgiumBelizeBoliviaBosnia and HerzegovinaBrazilBulgariaBurma/MyanmarCabo VerdeCambodiaCameroonCanadaCaribbeanCentral AmericaChileChinaColombiaCongoCosta RicaCroatiaCubaCzechoslovakiaDenmarkDominicaDominican RepublicEastern AfricaEastern AsiaEastern EuropeEcuadorEgyptEl SalvadorEnglandEritreaEthiopiaEuropeFijiFranceGermanyGhanaGreeceGrenadaGuatemalaGuyanaHaitiHondurasHong KongHungaryIndiaIndonesiaIranIraqIrelandIsraelItalyJamaicaJapanJordanKazakhstanKenyaKoreaKuwaitLaosLatin AmericaLatviaLebanonLiberiaLithuaniaMalaysiaMexicoMicronesiaMiddle AfricaMoldovaMoroccoNepalNetherlandsNicaraguaNigeriaNorth AmericaNorth MacedoniaNorthern AfricaNorthern EuropeNorwayOceaniaPakistanPanamaPeruPhilippinesPolandPortugalRomaniaRussiaSaudi ArabiaScotlandSenegalSerbiaSierra LeoneSingaporeSomaliaSouth AfricaSouth AmericaSouth Central AsiaSouth Eastern AsiaSouthern EuropeSpainSri LankaSt. Vincent and the GrenadinesSudanSwedenSwitzerlandSyriaTaiwanThailandTrinidad and TobagoTurkeyUgandaUkraineUruguayUzbekistanVenezuelaVietnamWest IndiesWestern AfricaWestern AsiaWestern EuropeYemenZaireZimbabwe
Immigrants from the Azores
Race
Ancestry
AfghanAfricanAlaska NativeAlaskan AthabascanAlbanianAleutAlsatianAmericanApacheArabArapahoArgentineanArmenianAssyrian/Chaldean/SyriacAustrianBahamianBangladeshiBarbadianBasqueBelgianBelizeanBermudanBhutaneseBlackfeetBolivianBrazilianBritishBritish West IndianBulgarianBurmeseCajunCambodianCanadianCape VerdeanCarpatho RusynCelticCentral AmericanCentral American IndianCherokeeCheyenneChickasawChileanChineseChippewaChoctawColombianColvilleComancheCosta RicanCreeCreekCroatianCrowCubanCypriotCzechCzechoslovakianDanishDelawareDominicanDutchDutch West IndianEastern EuropeanEcuadorianEgyptianEnglishEstonianEthiopianEuropeanFijianFilipinoFinnishFrenchFrench American IndianFrench CanadianGermanGerman RussianGhanaianGreekGuamanian/ChamorroGuatemalanGuyaneseHaitianHmongHonduranHopiHoumaHungarianIcelanderIndian (Asian)IndonesianInupiatIranianIraqiIrishIroquoisIsraeliItalianJamaicanJapaneseJordanianKenyanKiowaKoreanLaotianLatvianLebaneseLiberianLithuanianLumbeeLuxembourgerMacedonianMalaysianMalteseMarshalleseMenomineeMexicanMexican American IndianMongolianMoroccanNative HawaiianNavajoNepaleseNew ZealanderNicaraguanNigerianNorthern EuropeanNorwegianOkinawanOsageOttawaPaiutePakistaniPalestinianPanamanianParaguayanPennsylvania GermanPeruvianPimaPolishPortuguesePotawatomiPuebloPuerto RicanPuget Sound SalishRomanianRussianSalvadoranSamoanScandinavianScotch-IrishScottishSeminoleSenegaleseSerbianShoshoneSierra LeoneanSiouxSlavicSlovakSloveneSomaliSouth AfricanSouth AmericanSouth American IndianSoviet UnionSpaniardSpanishSpanish AmericanSpanish American IndianSri LankanSubsaharan AfricanSudaneseSwedishSwissSyrianTaiwaneseThaiTlingit-HaidaTohono O'OdhamTonganTrinidadian and TobagonianTsimshianTurkishU.S. Virgin IslanderUgandanUkrainianUruguayanUteVenezuelanVietnameseWelshWest IndianYakamaYaquiYugoslavianYumanYup'ikZimbabwean
Immigration
NonimmigrantsImmigrantsAfghanistanAfricaAlbaniaArgentinaArmeniaAsiaAustraliaAustriaBahamasBangladeshBarbadosBelarusBelgiumBelizeBoliviaBosnia and HerzegovinaBrazilBulgariaBurma/MyanmarCabo VerdeCambodiaCameroonCanadaCaribbeanCentral AmericaChileChinaColombiaCongoCosta RicaCroatiaCubaCzechoslovakiaDenmarkDominicaDominican RepublicEastern AfricaEastern AsiaEastern EuropeEcuadorEgyptEl SalvadorEnglandEritreaEthiopiaEuropeFijiFranceGermanyGhanaGreeceGrenadaGuatemalaGuyanaHaitiHondurasHong KongHungaryIndiaIndonesiaIranIraqIrelandIsraelItalyJamaicaJapanJordanKazakhstanKenyaKoreaKuwaitLaosLatin AmericaLatviaLebanonLiberiaLithuaniaMalaysiaMexicoMicronesiaMiddle AfricaMoldovaMoroccoNepalNetherlandsNicaraguaNigeriaNorth AmericaNorth MacedoniaNorthern AfricaNorthern EuropeNorwayOceaniaPakistanPanamaPeruPhilippinesPolandPortugalRomaniaRussiaSaudi ArabiaScotlandSenegalSerbiaSierra LeoneSingaporeSomaliaSouth AfricaSouth AmericaSouth Central AsiaSouth Eastern AsiaSouthern EuropeSpainSri LankaSt. Vincent and the GrenadinesSudanSwedenSwitzerlandSyriaTaiwanThailandTrinidad and TobagoTurkeyUgandaUkraineUruguayUzbekistanVenezuelaVietnamWest IndiesWestern AfricaWestern AsiaWestern EuropeYemenZaireZimbabweAzores
Female Unemployment
Income
Poverty
Unemployment
Labor Participation
Family Structure
Vehicle Availability
Education Level
Disability

Female Unemployment Comparison

Australians

Immigrants from the Azores

Exceptional
Tragic
4.9%
FEMALE UNEMPLOYMENT
99.2/ 100
METRIC RATING
49th/ 347
METRIC RANK
5.8%
FEMALE UNEMPLOYMENT
0.1/ 100
METRIC RATING
263rd/ 347
METRIC RANK

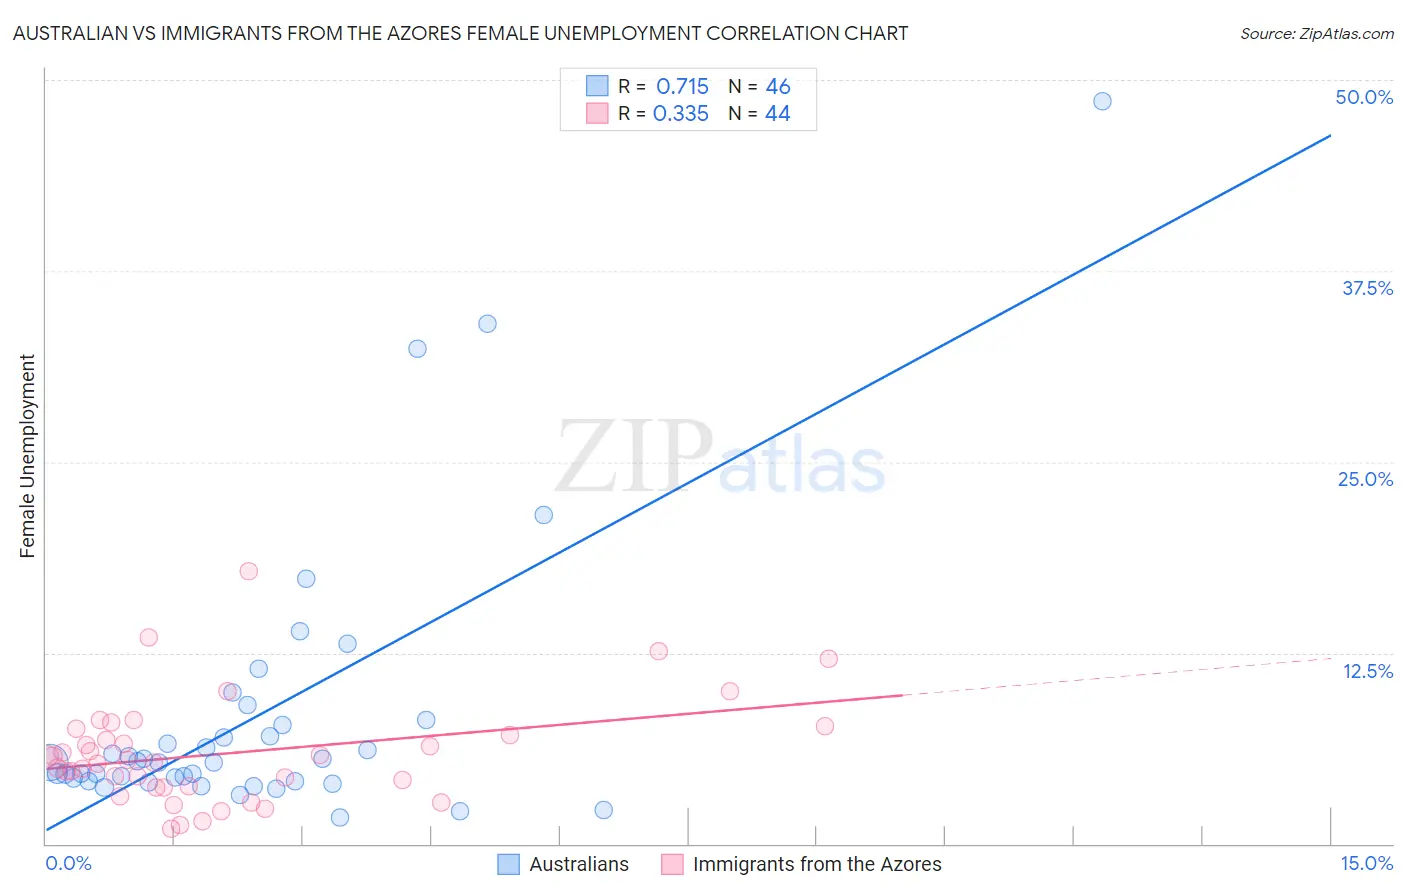
Australian vs Immigrants from the Azores Female Unemployment Correlation Chart

The statistical analysis conducted on geographies consisting of 223,483,579 people shows a strong positive correlation between the proportion of Australians and unemploymnet rate among females in the United States with a correlation coefficient (R) of 0.715 and weighted average of 4.9%. Similarly, the statistical analysis conducted on geographies consisting of 46,148,620 people shows a mild positive correlation between the proportion of Immigrants from the Azores and unemploymnet rate among females in the United States with a correlation coefficient (R) of 0.335 and weighted average of 5.8%, a difference of 19.3%.
Australian vs Immigrants from the Azores Female Unemployment

Female Unemployment Correlation Summary

MeasurementAustralianImmigrants from the Azores
Minimum1.7%1.0%
Maximum48.6%17.8%
Range46.9%16.8%
Mean8.4%5.9%
Median5.3%5.4%
Interquartile 25% (IQ1)4.1%3.7%
Interquartile 75% (IQ3)7.8%7.3%
Interquartile Range (IQR)3.7%3.6%
Standard Deviation (Sample)9.1%3.4%
Standard Deviation (Population)9.0%3.4%

Similar Demographics by Female Unemployment

Demographics Similar to Australians by Female Unemployment

In terms of female unemployment, the demographic groups most similar to Australians are Thai (4.9%, a difference of 0.0%), Okinawan (4.9%, a difference of 0.21%), Immigrants from Cuba (4.9%, a difference of 0.24%), Cambodian (4.9%, a difference of 0.25%), and Slavic (4.9%, a difference of 0.27%).
DemographicsRating | RankFemale Unemployment
Italians
99.5
/100
|
#42
Exceptional
4.8%
Eastern Europeans
99.4
/100
|
#43
Exceptional
4.9%
Greeks
99.4
/100
|
#44
Exceptional
4.9%
Austrians
99.3
/100
|
#45
Exceptional
4.9%
Immigrants | Bulgaria
99.3
/100
|
#46
Exceptional
4.9%
Okinawans
99.3
/100
|
#47
Exceptional
4.9%
Thais
99.2
/100
|
#48
Exceptional
4.9%
Australians
99.2
/100
|
#49
Exceptional
4.9%
Immigrants | Cuba
99.1
/100
|
#50
Exceptional
4.9%
Cambodians
99.1
/100
|
#51
Exceptional
4.9%
Slavs
99.1
/100
|
#52
Exceptional
4.9%
Whites/Caucasians
99.0
/100
|
#53
Exceptional
4.9%
Immigrants | Zimbabwe
99.0
/100
|
#54
Exceptional
4.9%
Immigrants | Moldova
99.0
/100
|
#55
Exceptional
4.9%
Serbians
99.0
/100
|
#56
Exceptional
4.9%

Demographics Similar to Immigrants from the Azores by Female Unemployment

In terms of female unemployment, the demographic groups most similar to Immigrants from the Azores are Immigrants from Bahamas (5.8%, a difference of 0.39%), Immigrants from Nigeria (5.8%, a difference of 0.67%), Kiowa (5.8%, a difference of 0.71%), Blackfeet (5.9%, a difference of 0.79%), and Nigerian (5.8%, a difference of 0.97%).
DemographicsRating | RankFemale Unemployment
Sub-Saharan Africans
0.4
/100
|
#256
Tragic
5.7%
Dutch West Indians
0.3
/100
|
#257
Tragic
5.7%
Immigrants | Portugal
0.2
/100
|
#258
Tragic
5.8%
Immigrants | Fiji
0.2
/100
|
#259
Tragic
5.8%
Nigerians
0.2
/100
|
#260
Tragic
5.8%
Kiowa
0.1
/100
|
#261
Tragic
5.8%
Immigrants | Nigeria
0.1
/100
|
#262
Tragic
5.8%
Immigrants | Azores
0.1
/100
|
#263
Tragic
5.8%
Immigrants | Bahamas
0.1
/100
|
#264
Tragic
5.8%
Blackfeet
0.0
/100
|
#265
Tragic
5.9%
Cape Verdeans
0.0
/100
|
#266
Tragic
5.9%
Nepalese
0.0
/100
|
#267
Tragic
5.9%
Hondurans
0.0
/100
|
#268
Tragic
5.9%
Immigrants | Western Africa
0.0
/100
|
#269
Tragic
5.9%
Immigrants | Honduras
0.0
/100
|
#270
Tragic
5.9%