Maltese vs Immigrants from the Azores Female Unemployment
COMPARE
Maltese
Immigrants from the Azores
Female Unemployment
Female Unemployment Comparison
Maltese
Immigrants from the Azores
5.1%
FEMALE UNEMPLOYMENT
85.5/ 100
METRIC RATING
130th/ 347
METRIC RANK
5.8%
FEMALE UNEMPLOYMENT
0.1/ 100
METRIC RATING
263rd/ 347
METRIC RANK
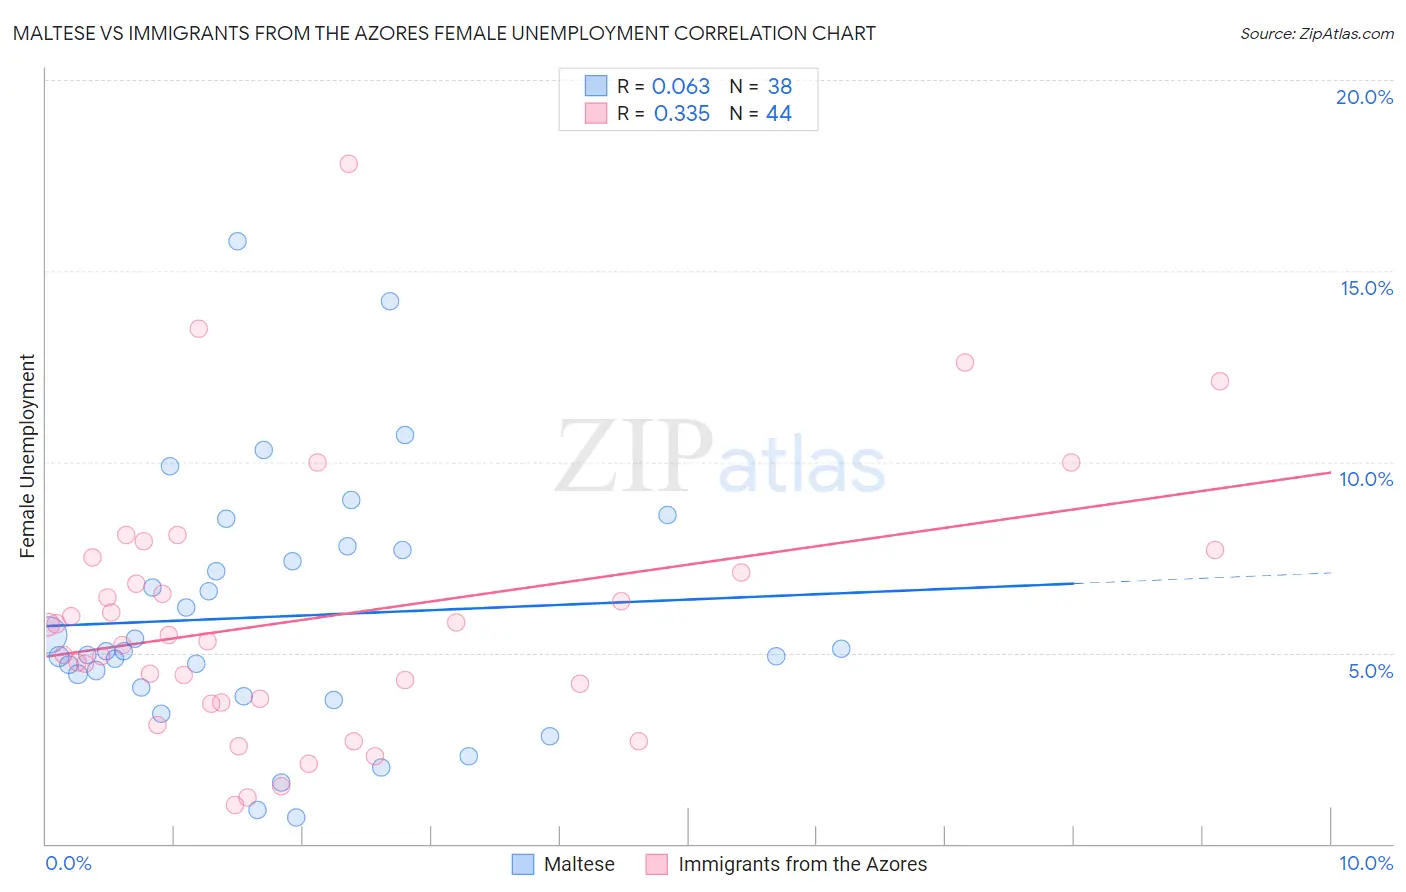
Maltese vs Immigrants from the Azores Female Unemployment Correlation Chart
The statistical analysis conducted on geographies consisting of 126,272,771 people shows a slight positive correlation between the proportion of Maltese and unemploymnet rate among females in the United States with a correlation coefficient (R) of 0.063 and weighted average of 5.1%. Similarly, the statistical analysis conducted on geographies consisting of 46,148,620 people shows a mild positive correlation between the proportion of Immigrants from the Azores and unemploymnet rate among females in the United States with a correlation coefficient (R) of 0.335 and weighted average of 5.8%, a difference of 13.7%.
Female Unemployment Correlation Summary
| Measurement | Maltese | Immigrants from the Azores |
| Minimum | 0.70% | 1.0% |
| Maximum | 15.8% | 17.8% |
| Range | 15.1% | 16.8% |
| Mean | 5.9% | 5.9% |
| Median | 5.0% | 5.4% |
| Interquartile 25% (IQ1) | 4.1% | 3.7% |
| Interquartile 75% (IQ3) | 7.7% | 7.3% |
| Interquartile Range (IQR) | 3.6% | 3.6% |
| Standard Deviation (Sample) | 3.3% | 3.4% |
| Standard Deviation (Population) | 3.2% | 3.4% |
Similar Demographics by Female Unemployment
Demographics Similar to Maltese by Female Unemployment
In terms of female unemployment, the demographic groups most similar to Maltese are Immigrants from Ethiopia (5.1%, a difference of 0.020%), Ethiopian (5.1%, a difference of 0.030%), Chilean (5.1%, a difference of 0.040%), Immigrants from Hungary (5.1%, a difference of 0.070%), and Immigrants from Sri Lanka (5.1%, a difference of 0.070%).
| Demographics | Rating | Rank | Female Unemployment |
| Immigrants | South Africa | 87.6 /100 | #123 | Excellent 5.1% |
| Immigrants | Europe | 87.2 /100 | #124 | Excellent 5.1% |
| Basques | 86.5 /100 | #125 | Excellent 5.1% |
| Immigrants | Korea | 86.3 /100 | #126 | Excellent 5.1% |
| Immigrants | Hungary | 86.0 /100 | #127 | Excellent 5.1% |
| Chileans | 85.8 /100 | #128 | Excellent 5.1% |
| Ethiopians | 85.7 /100 | #129 | Excellent 5.1% |
| Maltese | 85.5 /100 | #130 | Excellent 5.1% |
| Immigrants | Ethiopia | 85.4 /100 | #131 | Excellent 5.1% |
| Immigrants | Sri Lanka | 85.0 /100 | #132 | Excellent 5.1% |
| Immigrants | Hong Kong | 84.8 /100 | #133 | Excellent 5.1% |
| Immigrants | Eritrea | 84.6 /100 | #134 | Excellent 5.1% |
| Immigrants | Latvia | 84.6 /100 | #135 | Excellent 5.1% |
| Indians (Asian) | 84.2 /100 | #136 | Excellent 5.1% |
| Pakistanis | 83.8 /100 | #137 | Excellent 5.1% |
Demographics Similar to Immigrants from the Azores by Female Unemployment
In terms of female unemployment, the demographic groups most similar to Immigrants from the Azores are Immigrants from Bahamas (5.8%, a difference of 0.39%), Immigrants from Nigeria (5.8%, a difference of 0.67%), Kiowa (5.8%, a difference of 0.71%), Blackfeet (5.9%, a difference of 0.79%), and Nigerian (5.8%, a difference of 0.97%).
| Demographics | Rating | Rank | Female Unemployment |
| Sub-Saharan Africans | 0.4 /100 | #256 | Tragic 5.7% |
| Dutch West Indians | 0.3 /100 | #257 | Tragic 5.7% |
| Immigrants | Portugal | 0.2 /100 | #258 | Tragic 5.8% |
| Immigrants | Fiji | 0.2 /100 | #259 | Tragic 5.8% |
| Nigerians | 0.2 /100 | #260 | Tragic 5.8% |
| Kiowa | 0.1 /100 | #261 | Tragic 5.8% |
| Immigrants | Nigeria | 0.1 /100 | #262 | Tragic 5.8% |
| Immigrants | Azores | 0.1 /100 | #263 | Tragic 5.8% |
| Immigrants | Bahamas | 0.1 /100 | #264 | Tragic 5.8% |
| Blackfeet | 0.0 /100 | #265 | Tragic 5.9% |
| Cape Verdeans | 0.0 /100 | #266 | Tragic 5.9% |
| Nepalese | 0.0 /100 | #267 | Tragic 5.9% |
| Hondurans | 0.0 /100 | #268 | Tragic 5.9% |
| Immigrants | Western Africa | 0.0 /100 | #269 | Tragic 5.9% |
| Immigrants | Honduras | 0.0 /100 | #270 | Tragic 5.9% |