Colombian vs Ecuadorian Unemployment Among Women with Children Ages 6 to 17 years
COMPARE
Colombian
Ecuadorian
Unemployment Among Women with Children Ages 6 to 17 years
Unemployment Among Women with Children Ages 6 to 17 years Comparison
Colombians
Ecuadorians
9.3%
UNEMPLOYMENT AMONG WOMEN WITH CHILDREN AGES 6 TO 17 YEARS
2.2/ 100
METRIC RATING
241st/ 347
METRIC RANK
10.0%
UNEMPLOYMENT AMONG WOMEN WITH CHILDREN AGES 6 TO 17 YEARS
0.0/ 100
METRIC RATING
294th/ 347
METRIC RANK
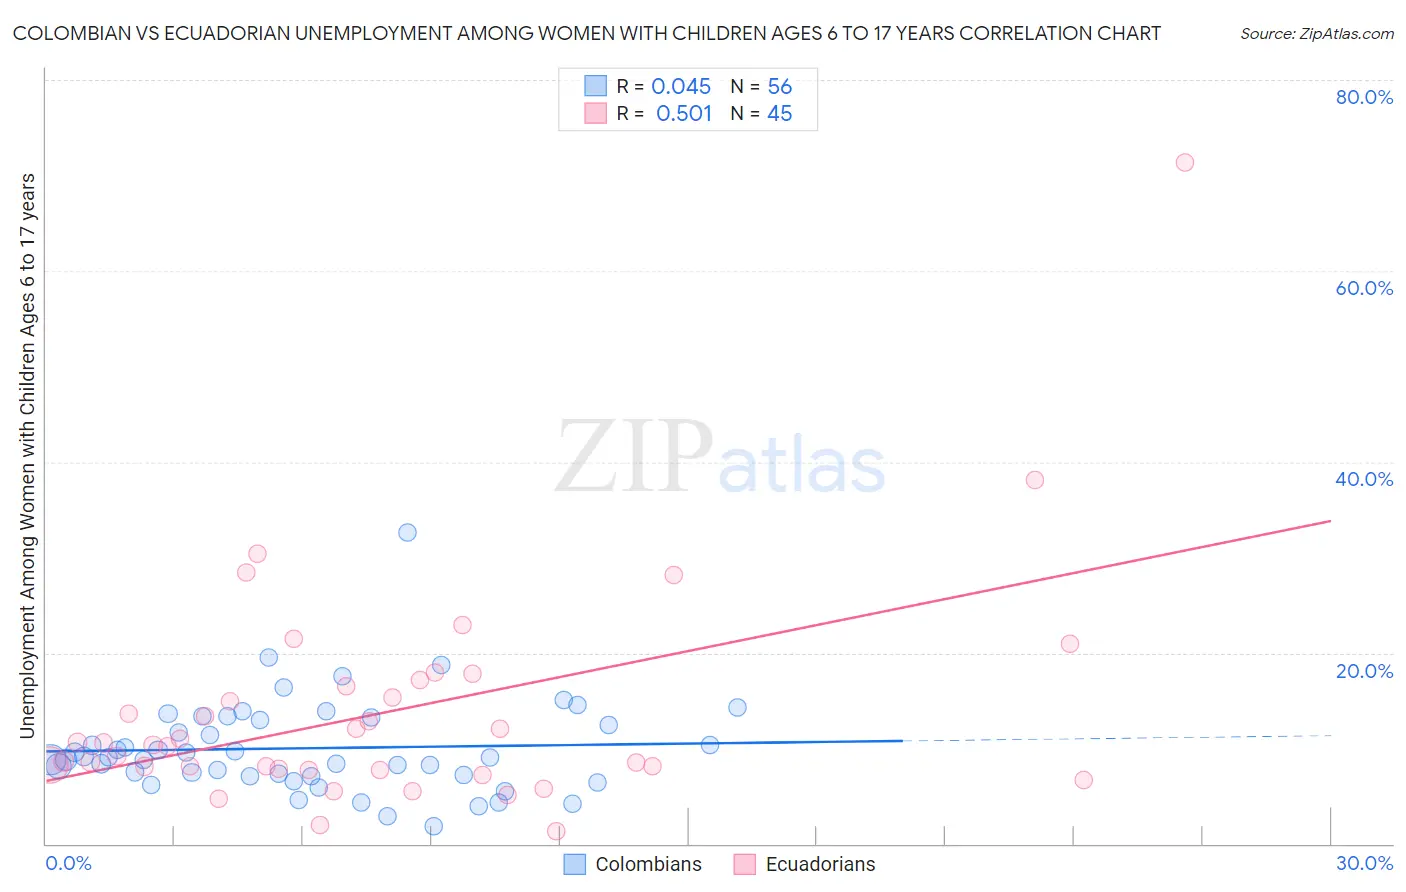
Colombian vs Ecuadorian Unemployment Among Women with Children Ages 6 to 17 years Correlation Chart
The statistical analysis conducted on geographies consisting of 301,134,838 people shows no correlation between the proportion of Colombians and unemployment rate among women with children between the ages 6 and 17 in the United States with a correlation coefficient (R) of 0.045 and weighted average of 9.3%. Similarly, the statistical analysis conducted on geographies consisting of 242,852,218 people shows a substantial positive correlation between the proportion of Ecuadorians and unemployment rate among women with children between the ages 6 and 17 in the United States with a correlation coefficient (R) of 0.501 and weighted average of 10.0%, a difference of 7.3%.
Unemployment Among Women with Children Ages 6 to 17 years Correlation Summary
| Measurement | Colombian | Ecuadorian |
| Minimum | 1.8% | 1.3% |
| Maximum | 32.7% | 71.4% |
| Range | 30.9% | 70.1% |
| Mean | 10.0% | 13.8% |
| Median | 9.0% | 10.3% |
| Interquartile 25% (IQ1) | 7.2% | 7.8% |
| Interquartile 75% (IQ3) | 13.1% | 16.8% |
| Interquartile Range (IQR) | 5.9% | 9.0% |
| Standard Deviation (Sample) | 5.0% | 11.7% |
| Standard Deviation (Population) | 4.9% | 11.6% |
Similar Demographics by Unemployment Among Women with Children Ages 6 to 17 years
Demographics Similar to Colombians by Unemployment Among Women with Children Ages 6 to 17 years
In terms of unemployment among women with children ages 6 to 17 years, the demographic groups most similar to Colombians are Immigrants from Colombia (9.3%, a difference of 0.020%), Guatemalan (9.3%, a difference of 0.070%), Scottish (9.4%, a difference of 0.11%), English (9.4%, a difference of 0.16%), and Immigrants from Cameroon (9.4%, a difference of 0.19%).
| Demographics | Rating | Rank | Unemployment Among Women with Children Ages 6 to 17 years |
| Mexicans | 3.2 /100 | #234 | Tragic 9.3% |
| Uruguayans | 3.0 /100 | #235 | Tragic 9.3% |
| Hungarians | 3.0 /100 | #236 | Tragic 9.3% |
| Immigrants | Belize | 2.8 /100 | #237 | Tragic 9.3% |
| Arabs | 2.7 /100 | #238 | Tragic 9.3% |
| Immigrants | Saudi Arabia | 2.7 /100 | #239 | Tragic 9.3% |
| Guatemalans | 2.3 /100 | #240 | Tragic 9.3% |
| Colombians | 2.2 /100 | #241 | Tragic 9.3% |
| Immigrants | Colombia | 2.1 /100 | #242 | Tragic 9.3% |
| Scottish | 2.0 /100 | #243 | Tragic 9.4% |
| English | 1.9 /100 | #244 | Tragic 9.4% |
| Immigrants | Cameroon | 1.8 /100 | #245 | Tragic 9.4% |
| Immigrants | Africa | 1.6 /100 | #246 | Tragic 9.4% |
| Poles | 1.5 /100 | #247 | Tragic 9.4% |
| Dutch | 1.5 /100 | #248 | Tragic 9.4% |
Demographics Similar to Ecuadorians by Unemployment Among Women with Children Ages 6 to 17 years
In terms of unemployment among women with children ages 6 to 17 years, the demographic groups most similar to Ecuadorians are Cherokee (10.0%, a difference of 0.030%), Haitian (10.0%, a difference of 0.090%), Carpatho Rusyn (10.0%, a difference of 0.18%), Nonimmigrants (10.0%, a difference of 0.19%), and Subsaharan African (10.0%, a difference of 0.22%).
| Demographics | Rating | Rank | Unemployment Among Women with Children Ages 6 to 17 years |
| Sierra Leoneans | 0.0 /100 | #287 | Tragic 9.9% |
| Shoshone | 0.0 /100 | #288 | Tragic 10.0% |
| Hondurans | 0.0 /100 | #289 | Tragic 10.0% |
| Sub-Saharan Africans | 0.0 /100 | #290 | Tragic 10.0% |
| Immigrants | Nonimmigrants | 0.0 /100 | #291 | Tragic 10.0% |
| Carpatho Rusyns | 0.0 /100 | #292 | Tragic 10.0% |
| Haitians | 0.0 /100 | #293 | Tragic 10.0% |
| Ecuadorians | 0.0 /100 | #294 | Tragic 10.0% |
| Cherokee | 0.0 /100 | #295 | Tragic 10.0% |
| Immigrants | Western Africa | 0.0 /100 | #296 | Tragic 10.1% |
| Immigrants | Caribbean | 0.0 /100 | #297 | Tragic 10.1% |
| Immigrants | Haiti | 0.0 /100 | #298 | Tragic 10.1% |
| Immigrants | Honduras | 0.0 /100 | #299 | Tragic 10.1% |
| Nigerians | 0.0 /100 | #300 | Tragic 10.1% |
| Immigrants | Bahamas | 0.0 /100 | #301 | Tragic 10.1% |