Norwegian vs Ecuadorian Unemployment Among Women with Children Ages 6 to 17 years
COMPARE
Norwegian
Ecuadorian
Unemployment Among Women with Children Ages 6 to 17 years
Unemployment Among Women with Children Ages 6 to 17 years Comparison
Norwegians
Ecuadorians
8.3%
UNEMPLOYMENT AMONG WOMEN WITH CHILDREN AGES 6 TO 17 YEARS
99.9/ 100
METRIC RATING
70th/ 347
METRIC RANK
10.0%
UNEMPLOYMENT AMONG WOMEN WITH CHILDREN AGES 6 TO 17 YEARS
0.0/ 100
METRIC RATING
294th/ 347
METRIC RANK
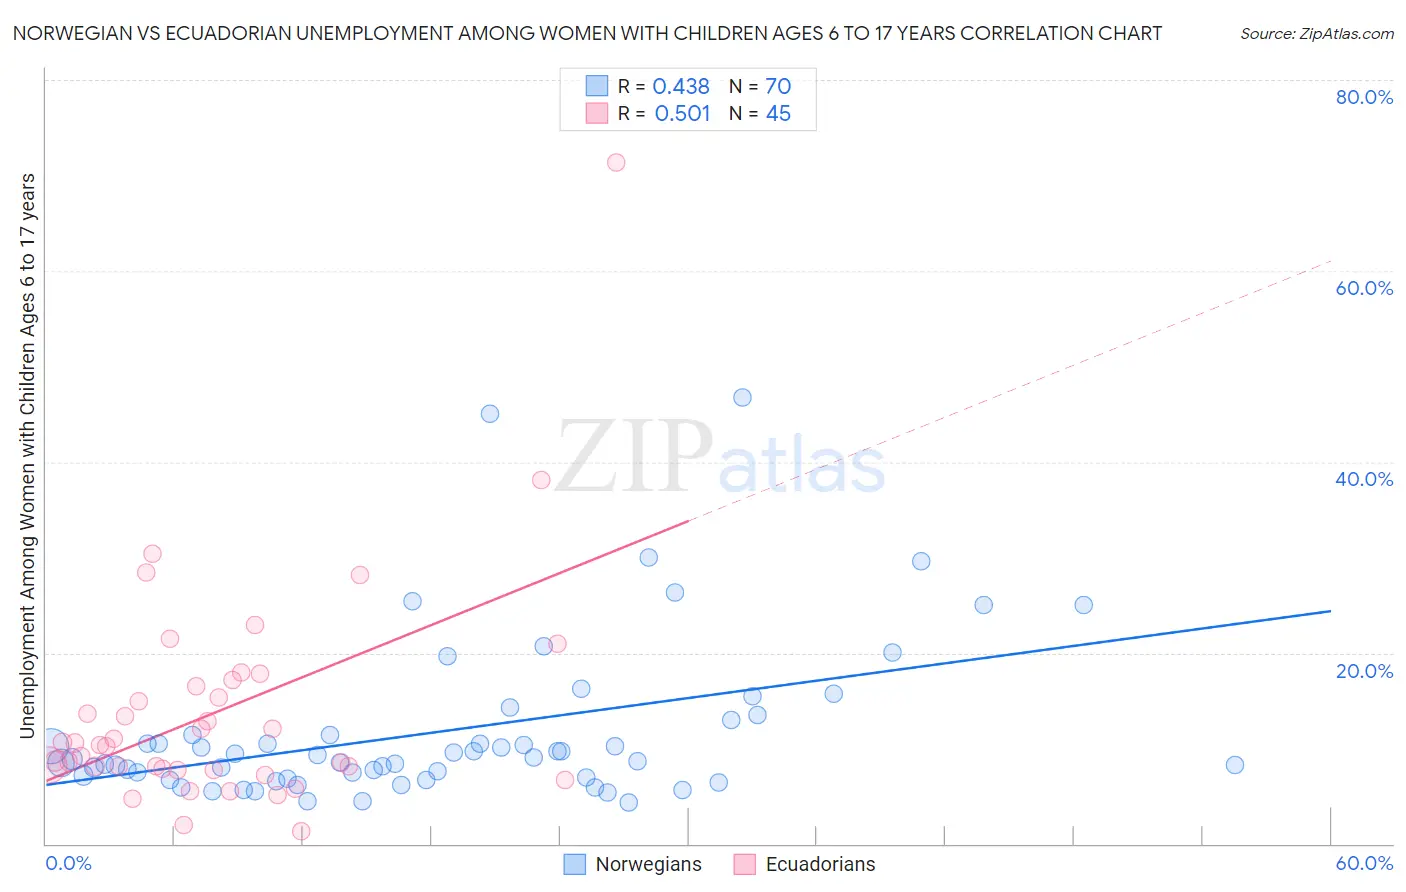
Norwegian vs Ecuadorian Unemployment Among Women with Children Ages 6 to 17 years Correlation Chart
The statistical analysis conducted on geographies consisting of 341,583,618 people shows a moderate positive correlation between the proportion of Norwegians and unemployment rate among women with children between the ages 6 and 17 in the United States with a correlation coefficient (R) of 0.438 and weighted average of 8.3%. Similarly, the statistical analysis conducted on geographies consisting of 242,852,218 people shows a substantial positive correlation between the proportion of Ecuadorians and unemployment rate among women with children between the ages 6 and 17 in the United States with a correlation coefficient (R) of 0.501 and weighted average of 10.0%, a difference of 20.6%.
Unemployment Among Women with Children Ages 6 to 17 years Correlation Summary
| Measurement | Norwegian | Ecuadorian |
| Minimum | 4.3% | 1.3% |
| Maximum | 46.7% | 71.4% |
| Range | 42.4% | 70.1% |
| Mean | 11.8% | 13.8% |
| Median | 8.9% | 10.3% |
| Interquartile 25% (IQ1) | 6.9% | 7.8% |
| Interquartile 75% (IQ3) | 11.4% | 16.8% |
| Interquartile Range (IQR) | 4.5% | 9.0% |
| Standard Deviation (Sample) | 8.5% | 11.7% |
| Standard Deviation (Population) | 8.4% | 11.6% |
Similar Demographics by Unemployment Among Women with Children Ages 6 to 17 years
Demographics Similar to Norwegians by Unemployment Among Women with Children Ages 6 to 17 years
In terms of unemployment among women with children ages 6 to 17 years, the demographic groups most similar to Norwegians are Immigrants from Australia (8.3%, a difference of 0.060%), Immigrants from Thailand (8.3%, a difference of 0.080%), Immigrants from Nepal (8.3%, a difference of 0.10%), Marshallese (8.3%, a difference of 0.11%), and Armenian (8.3%, a difference of 0.19%).
| Demographics | Rating | Rank | Unemployment Among Women with Children Ages 6 to 17 years |
| Immigrants | South Eastern Asia | 99.9 /100 | #63 | Exceptional 8.2% |
| Immigrants | Kuwait | 99.9 /100 | #64 | Exceptional 8.3% |
| Immigrants | Albania | 99.9 /100 | #65 | Exceptional 8.3% |
| Luxembourgers | 99.9 /100 | #66 | Exceptional 8.3% |
| Armenians | 99.9 /100 | #67 | Exceptional 8.3% |
| Marshallese | 99.9 /100 | #68 | Exceptional 8.3% |
| Immigrants | Thailand | 99.9 /100 | #69 | Exceptional 8.3% |
| Norwegians | 99.9 /100 | #70 | Exceptional 8.3% |
| Immigrants | Australia | 99.8 /100 | #71 | Exceptional 8.3% |
| Immigrants | Nepal | 99.8 /100 | #72 | Exceptional 8.3% |
| Spanish Americans | 99.8 /100 | #73 | Exceptional 8.4% |
| Samoans | 99.7 /100 | #74 | Exceptional 8.4% |
| Immigrants | Sri Lanka | 99.7 /100 | #75 | Exceptional 8.4% |
| Immigrants | Moldova | 99.7 /100 | #76 | Exceptional 8.4% |
| Iraqis | 99.7 /100 | #77 | Exceptional 8.4% |
Demographics Similar to Ecuadorians by Unemployment Among Women with Children Ages 6 to 17 years
In terms of unemployment among women with children ages 6 to 17 years, the demographic groups most similar to Ecuadorians are Cherokee (10.0%, a difference of 0.030%), Haitian (10.0%, a difference of 0.090%), Carpatho Rusyn (10.0%, a difference of 0.18%), Nonimmigrants (10.0%, a difference of 0.19%), and Subsaharan African (10.0%, a difference of 0.22%).
| Demographics | Rating | Rank | Unemployment Among Women with Children Ages 6 to 17 years |
| Sierra Leoneans | 0.0 /100 | #287 | Tragic 9.9% |
| Shoshone | 0.0 /100 | #288 | Tragic 10.0% |
| Hondurans | 0.0 /100 | #289 | Tragic 10.0% |
| Sub-Saharan Africans | 0.0 /100 | #290 | Tragic 10.0% |
| Immigrants | Nonimmigrants | 0.0 /100 | #291 | Tragic 10.0% |
| Carpatho Rusyns | 0.0 /100 | #292 | Tragic 10.0% |
| Haitians | 0.0 /100 | #293 | Tragic 10.0% |
| Ecuadorians | 0.0 /100 | #294 | Tragic 10.0% |
| Cherokee | 0.0 /100 | #295 | Tragic 10.0% |
| Immigrants | Western Africa | 0.0 /100 | #296 | Tragic 10.1% |
| Immigrants | Caribbean | 0.0 /100 | #297 | Tragic 10.1% |
| Immigrants | Haiti | 0.0 /100 | #298 | Tragic 10.1% |
| Immigrants | Honduras | 0.0 /100 | #299 | Tragic 10.1% |
| Nigerians | 0.0 /100 | #300 | Tragic 10.1% |
| Immigrants | Bahamas | 0.0 /100 | #301 | Tragic 10.1% |