Colombian vs New Zealander Unemployment Among Women with Children Ages 6 to 17 years
COMPARE
Colombian
New Zealander
Unemployment Among Women with Children Ages 6 to 17 years
Unemployment Among Women with Children Ages 6 to 17 years Comparison
Colombians
New Zealanders
9.3%
UNEMPLOYMENT AMONG WOMEN WITH CHILDREN AGES 6 TO 17 YEARS
2.2/ 100
METRIC RATING
241st/ 347
METRIC RANK
8.6%
UNEMPLOYMENT AMONG WOMEN WITH CHILDREN AGES 6 TO 17 YEARS
98.4/ 100
METRIC RATING
100th/ 347
METRIC RANK
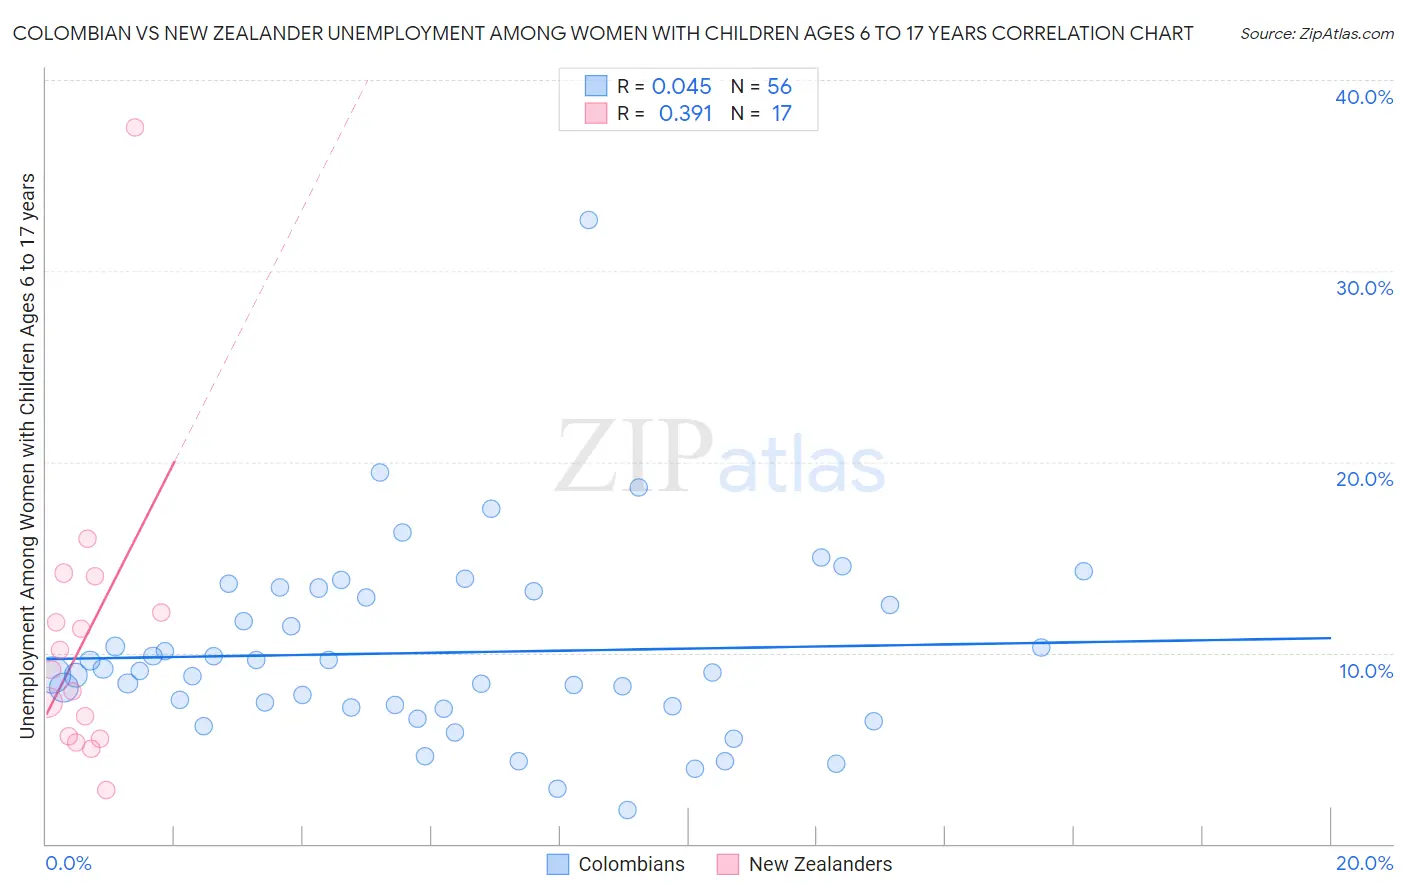
Colombian vs New Zealander Unemployment Among Women with Children Ages 6 to 17 years Correlation Chart
The statistical analysis conducted on geographies consisting of 301,134,838 people shows no correlation between the proportion of Colombians and unemployment rate among women with children between the ages 6 and 17 in the United States with a correlation coefficient (R) of 0.045 and weighted average of 9.3%. Similarly, the statistical analysis conducted on geographies consisting of 92,334,670 people shows a mild positive correlation between the proportion of New Zealanders and unemployment rate among women with children between the ages 6 and 17 in the United States with a correlation coefficient (R) of 0.391 and weighted average of 8.6%, a difference of 9.2%.
Unemployment Among Women with Children Ages 6 to 17 years Correlation Summary
| Measurement | Colombian | New Zealander |
| Minimum | 1.8% | 2.8% |
| Maximum | 32.7% | 37.5% |
| Range | 30.9% | 34.7% |
| Mean | 10.0% | 10.7% |
| Median | 9.0% | 9.1% |
| Interquartile 25% (IQ1) | 7.2% | 5.6% |
| Interquartile 75% (IQ3) | 13.1% | 13.1% |
| Interquartile Range (IQR) | 5.9% | 7.5% |
| Standard Deviation (Sample) | 5.0% | 7.9% |
| Standard Deviation (Population) | 4.9% | 7.6% |
Similar Demographics by Unemployment Among Women with Children Ages 6 to 17 years
Demographics Similar to Colombians by Unemployment Among Women with Children Ages 6 to 17 years
In terms of unemployment among women with children ages 6 to 17 years, the demographic groups most similar to Colombians are Immigrants from Colombia (9.3%, a difference of 0.020%), Guatemalan (9.3%, a difference of 0.070%), Scottish (9.4%, a difference of 0.11%), English (9.4%, a difference of 0.16%), and Immigrants from Cameroon (9.4%, a difference of 0.19%).
| Demographics | Rating | Rank | Unemployment Among Women with Children Ages 6 to 17 years |
| Mexicans | 3.2 /100 | #234 | Tragic 9.3% |
| Uruguayans | 3.0 /100 | #235 | Tragic 9.3% |
| Hungarians | 3.0 /100 | #236 | Tragic 9.3% |
| Immigrants | Belize | 2.8 /100 | #237 | Tragic 9.3% |
| Arabs | 2.7 /100 | #238 | Tragic 9.3% |
| Immigrants | Saudi Arabia | 2.7 /100 | #239 | Tragic 9.3% |
| Guatemalans | 2.3 /100 | #240 | Tragic 9.3% |
| Colombians | 2.2 /100 | #241 | Tragic 9.3% |
| Immigrants | Colombia | 2.1 /100 | #242 | Tragic 9.3% |
| Scottish | 2.0 /100 | #243 | Tragic 9.4% |
| English | 1.9 /100 | #244 | Tragic 9.4% |
| Immigrants | Cameroon | 1.8 /100 | #245 | Tragic 9.4% |
| Immigrants | Africa | 1.6 /100 | #246 | Tragic 9.4% |
| Poles | 1.5 /100 | #247 | Tragic 9.4% |
| Dutch | 1.5 /100 | #248 | Tragic 9.4% |
Demographics Similar to New Zealanders by Unemployment Among Women with Children Ages 6 to 17 years
In terms of unemployment among women with children ages 6 to 17 years, the demographic groups most similar to New Zealanders are Immigrants from Lithuania (8.6%, a difference of 0.0%), Immigrants from Pakistan (8.6%, a difference of 0.0%), Immigrants from South Africa (8.6%, a difference of 0.030%), Scandinavian (8.6%, a difference of 0.040%), and Malaysian (8.6%, a difference of 0.080%).
| Demographics | Rating | Rank | Unemployment Among Women with Children Ages 6 to 17 years |
| Australians | 98.9 /100 | #93 | Exceptional 8.5% |
| Immigrants | Barbados | 98.8 /100 | #94 | Exceptional 8.5% |
| Sri Lankans | 98.7 /100 | #95 | Exceptional 8.5% |
| German Russians | 98.6 /100 | #96 | Exceptional 8.5% |
| Bolivians | 98.5 /100 | #97 | Exceptional 8.5% |
| Malaysians | 98.5 /100 | #98 | Exceptional 8.6% |
| Immigrants | Lithuania | 98.4 /100 | #99 | Exceptional 8.6% |
| New Zealanders | 98.4 /100 | #100 | Exceptional 8.6% |
| Immigrants | Pakistan | 98.4 /100 | #101 | Exceptional 8.6% |
| Immigrants | South Africa | 98.3 /100 | #102 | Exceptional 8.6% |
| Scandinavians | 98.3 /100 | #103 | Exceptional 8.6% |
| Immigrants | France | 98.0 /100 | #104 | Exceptional 8.6% |
| Immigrants | Norway | 97.8 /100 | #105 | Exceptional 8.6% |
| Immigrants | Serbia | 97.7 /100 | #106 | Exceptional 8.6% |
| Chickasaw | 97.6 /100 | #107 | Exceptional 8.6% |