Colombian vs Immigrants from Israel Unemployment Among Women with Children Ages 6 to 17 years
COMPARE
Colombian
Immigrants from Israel
Unemployment Among Women with Children Ages 6 to 17 years
Unemployment Among Women with Children Ages 6 to 17 years Comparison
Colombians
Immigrants from Israel
9.3%
UNEMPLOYMENT AMONG WOMEN WITH CHILDREN AGES 6 TO 17 YEARS
2.2/ 100
METRIC RATING
241st/ 347
METRIC RANK
8.5%
UNEMPLOYMENT AMONG WOMEN WITH CHILDREN AGES 6 TO 17 YEARS
99.1/ 100
METRIC RATING
87th/ 347
METRIC RANK
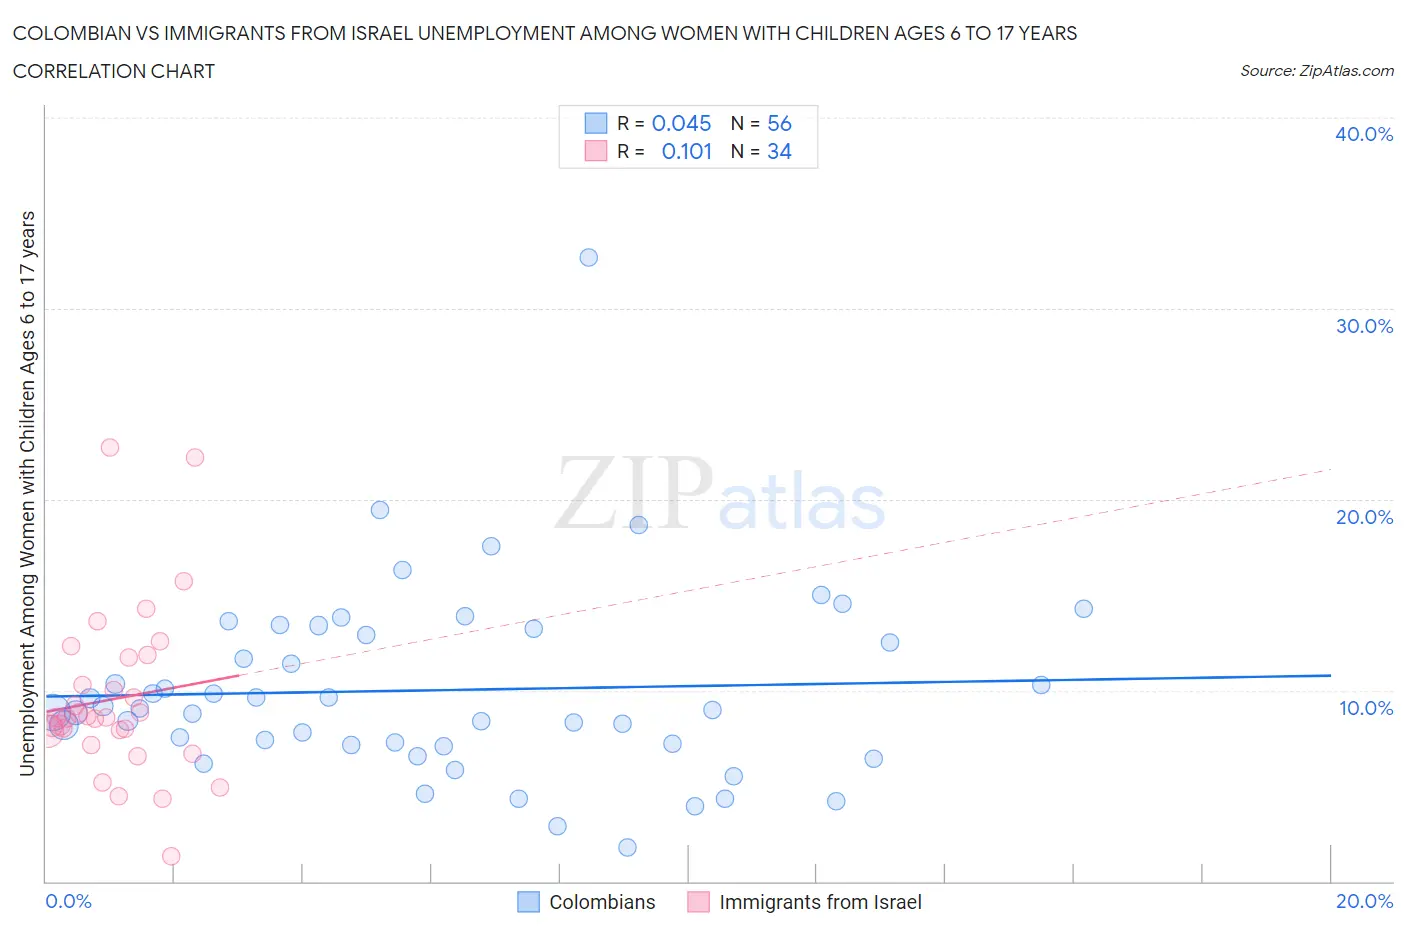
Colombian vs Immigrants from Israel Unemployment Among Women with Children Ages 6 to 17 years Correlation Chart
The statistical analysis conducted on geographies consisting of 301,134,838 people shows no correlation between the proportion of Colombians and unemployment rate among women with children between the ages 6 and 17 in the United States with a correlation coefficient (R) of 0.045 and weighted average of 9.3%. Similarly, the statistical analysis conducted on geographies consisting of 166,050,756 people shows a poor positive correlation between the proportion of Immigrants from Israel and unemployment rate among women with children between the ages 6 and 17 in the United States with a correlation coefficient (R) of 0.101 and weighted average of 8.5%, a difference of 10.0%.
Unemployment Among Women with Children Ages 6 to 17 years Correlation Summary
| Measurement | Colombian | Immigrants from Israel |
| Minimum | 1.8% | 1.3% |
| Maximum | 32.7% | 22.7% |
| Range | 30.9% | 21.4% |
| Mean | 10.0% | 9.6% |
| Median | 9.0% | 8.6% |
| Interquartile 25% (IQ1) | 7.2% | 7.8% |
| Interquartile 75% (IQ3) | 13.1% | 11.7% |
| Interquartile Range (IQR) | 5.9% | 3.9% |
| Standard Deviation (Sample) | 5.0% | 4.4% |
| Standard Deviation (Population) | 4.9% | 4.3% |
Similar Demographics by Unemployment Among Women with Children Ages 6 to 17 years
Demographics Similar to Colombians by Unemployment Among Women with Children Ages 6 to 17 years
In terms of unemployment among women with children ages 6 to 17 years, the demographic groups most similar to Colombians are Immigrants from Colombia (9.3%, a difference of 0.020%), Guatemalan (9.3%, a difference of 0.070%), Scottish (9.4%, a difference of 0.11%), English (9.4%, a difference of 0.16%), and Immigrants from Cameroon (9.4%, a difference of 0.19%).
| Demographics | Rating | Rank | Unemployment Among Women with Children Ages 6 to 17 years |
| Mexicans | 3.2 /100 | #234 | Tragic 9.3% |
| Uruguayans | 3.0 /100 | #235 | Tragic 9.3% |
| Hungarians | 3.0 /100 | #236 | Tragic 9.3% |
| Immigrants | Belize | 2.8 /100 | #237 | Tragic 9.3% |
| Arabs | 2.7 /100 | #238 | Tragic 9.3% |
| Immigrants | Saudi Arabia | 2.7 /100 | #239 | Tragic 9.3% |
| Guatemalans | 2.3 /100 | #240 | Tragic 9.3% |
| Colombians | 2.2 /100 | #241 | Tragic 9.3% |
| Immigrants | Colombia | 2.1 /100 | #242 | Tragic 9.3% |
| Scottish | 2.0 /100 | #243 | Tragic 9.4% |
| English | 1.9 /100 | #244 | Tragic 9.4% |
| Immigrants | Cameroon | 1.8 /100 | #245 | Tragic 9.4% |
| Immigrants | Africa | 1.6 /100 | #246 | Tragic 9.4% |
| Poles | 1.5 /100 | #247 | Tragic 9.4% |
| Dutch | 1.5 /100 | #248 | Tragic 9.4% |
Demographics Similar to Immigrants from Israel by Unemployment Among Women with Children Ages 6 to 17 years
In terms of unemployment among women with children ages 6 to 17 years, the demographic groups most similar to Immigrants from Israel are Immigrants from Vietnam (8.5%, a difference of 0.020%), Paiute (8.5%, a difference of 0.10%), Yugoslavian (8.5%, a difference of 0.13%), Immigrants from Eastern Europe (8.5%, a difference of 0.20%), and Potawatomi (8.5%, a difference of 0.22%).
| Demographics | Rating | Rank | Unemployment Among Women with Children Ages 6 to 17 years |
| Immigrants | Belarus | 99.6 /100 | #80 | Exceptional 8.4% |
| Immigrants | Bolivia | 99.6 /100 | #81 | Exceptional 8.4% |
| Cypriots | 99.6 /100 | #82 | Exceptional 8.4% |
| Bulgarians | 99.5 /100 | #83 | Exceptional 8.4% |
| Japanese | 99.5 /100 | #84 | Exceptional 8.4% |
| Immigrants | North Macedonia | 99.4 /100 | #85 | Exceptional 8.5% |
| Alaskan Athabascans | 99.4 /100 | #86 | Exceptional 8.5% |
| Immigrants | Israel | 99.1 /100 | #87 | Exceptional 8.5% |
| Immigrants | Vietnam | 99.1 /100 | #88 | Exceptional 8.5% |
| Paiute | 99.1 /100 | #89 | Exceptional 8.5% |
| Yugoslavians | 99.0 /100 | #90 | Exceptional 8.5% |
| Immigrants | Eastern Europe | 99.0 /100 | #91 | Exceptional 8.5% |
| Potawatomi | 99.0 /100 | #92 | Exceptional 8.5% |
| Australians | 98.9 /100 | #93 | Exceptional 8.5% |
| Immigrants | Barbados | 98.8 /100 | #94 | Exceptional 8.5% |