Colombian vs Ecuadorian Female Poverty Among 18-24 Year Olds
COMPARE
Colombian
Ecuadorian
Female Poverty Among 18-24 Year Olds
Female Poverty Among 18-24 Year Olds Comparison
Colombians
Ecuadorians
17.7%
FEMALE POVERTY AMONG 18-24 YEAR OLDS
100.0/ 100
METRIC RATING
27th/ 347
METRIC RANK
19.1%
FEMALE POVERTY AMONG 18-24 YEAR OLDS
98.1/ 100
METRIC RATING
101st/ 347
METRIC RANK
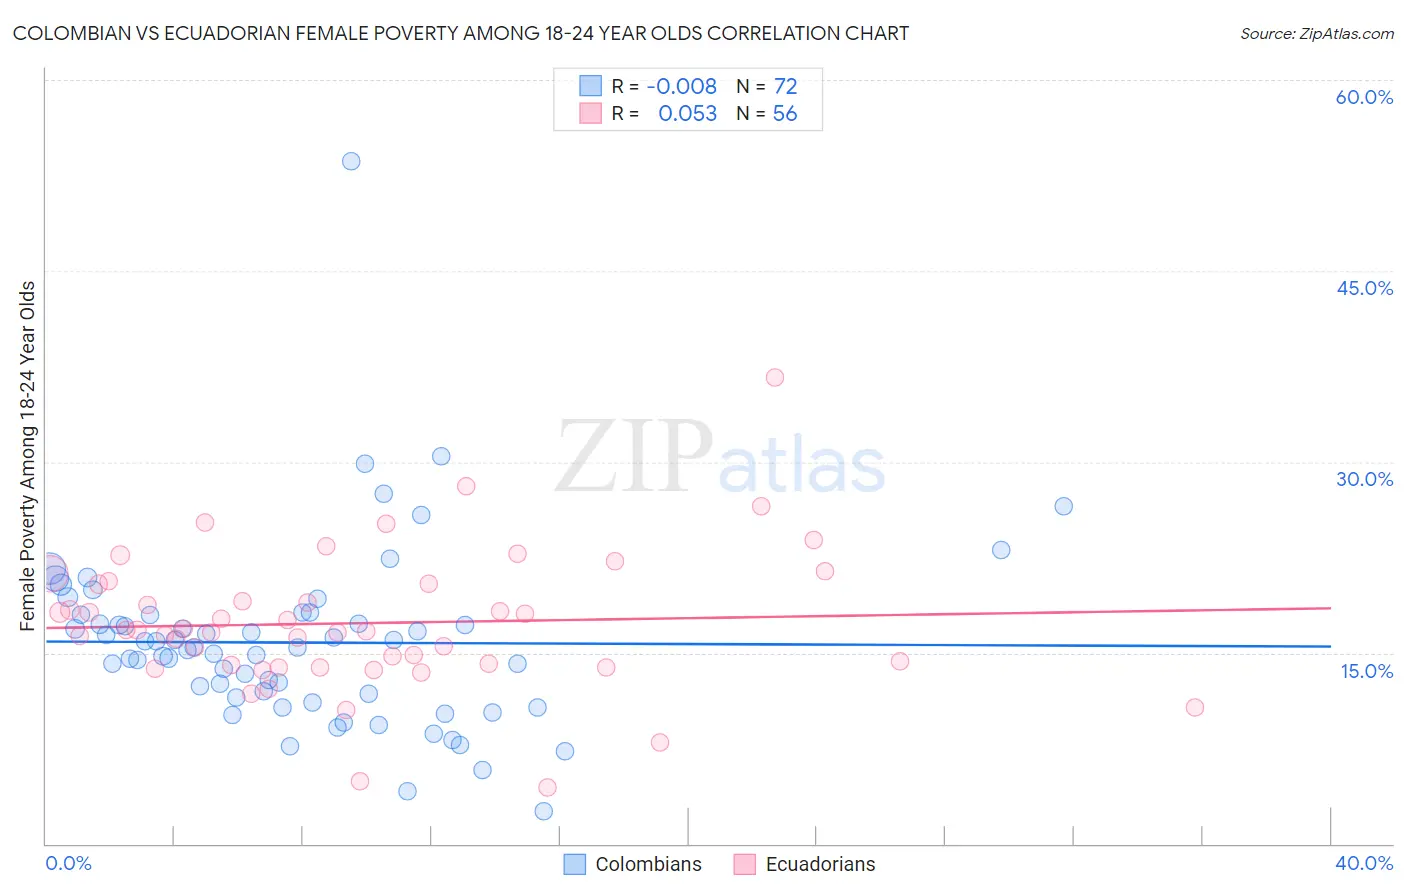
Colombian vs Ecuadorian Female Poverty Among 18-24 Year Olds Correlation Chart
The statistical analysis conducted on geographies consisting of 408,743,198 people shows no correlation between the proportion of Colombians and poverty level among females between the ages 18 and 24 in the United States with a correlation coefficient (R) of -0.008 and weighted average of 17.7%. Similarly, the statistical analysis conducted on geographies consisting of 311,495,994 people shows a slight positive correlation between the proportion of Ecuadorians and poverty level among females between the ages 18 and 24 in the United States with a correlation coefficient (R) of 0.053 and weighted average of 19.1%, a difference of 8.2%.
Female Poverty Among 18-24 Year Olds Correlation Summary
| Measurement | Colombian | Ecuadorian |
| Minimum | 2.5% | 4.4% |
| Maximum | 53.6% | 36.6% |
| Range | 51.0% | 32.2% |
| Mean | 15.8% | 17.3% |
| Median | 15.4% | 16.7% |
| Interquartile 25% (IQ1) | 11.6% | 14.0% |
| Interquartile 75% (IQ3) | 18.0% | 20.4% |
| Interquartile Range (IQR) | 6.4% | 6.4% |
| Standard Deviation (Sample) | 7.1% | 5.4% |
| Standard Deviation (Population) | 7.1% | 5.4% |
Similar Demographics by Female Poverty Among 18-24 Year Olds
Demographics Similar to Colombians by Female Poverty Among 18-24 Year Olds
In terms of female poverty among 18-24 year olds, the demographic groups most similar to Colombians are Immigrants from Fiji (17.7%, a difference of 0.11%), Venezuelan (17.7%, a difference of 0.14%), Immigrants from South Central Asia (17.6%, a difference of 0.43%), Portuguese (17.8%, a difference of 0.47%), and Maltese (17.6%, a difference of 0.61%).
| Demographics | Rating | Rank | Female Poverty Among 18-24 Year Olds |
| Immigrants | Venezuela | 100.0 /100 | #20 | Exceptional 17.4% |
| Bolivians | 100.0 /100 | #21 | Exceptional 17.4% |
| Immigrants | Hong Kong | 100.0 /100 | #22 | Exceptional 17.5% |
| Immigrants | North Macedonia | 100.0 /100 | #23 | Exceptional 17.6% |
| Maltese | 100.0 /100 | #24 | Exceptional 17.6% |
| Immigrants | South Central Asia | 100.0 /100 | #25 | Exceptional 17.6% |
| Immigrants | Fiji | 100.0 /100 | #26 | Exceptional 17.7% |
| Colombians | 100.0 /100 | #27 | Exceptional 17.7% |
| Venezuelans | 100.0 /100 | #28 | Exceptional 17.7% |
| Portuguese | 100.0 /100 | #29 | Exceptional 17.8% |
| Immigrants | South Eastern Asia | 100.0 /100 | #30 | Exceptional 17.8% |
| Immigrants | Vietnam | 100.0 /100 | #31 | Exceptional 17.8% |
| Immigrants | Moldova | 100.0 /100 | #32 | Exceptional 17.9% |
| Native Hawaiians | 100.0 /100 | #33 | Exceptional 17.9% |
| Immigrants | Nicaragua | 100.0 /100 | #34 | Exceptional 17.9% |
Demographics Similar to Ecuadorians by Female Poverty Among 18-24 Year Olds
In terms of female poverty among 18-24 year olds, the demographic groups most similar to Ecuadorians are Immigrants from Caribbean (19.1%, a difference of 0.020%), Serbian (19.1%, a difference of 0.070%), Chilean (19.1%, a difference of 0.090%), Immigrants from Czechoslovakia (19.1%, a difference of 0.11%), and Immigrants from Afghanistan (19.1%, a difference of 0.11%).
| Demographics | Rating | Rank | Female Poverty Among 18-24 Year Olds |
| Ukrainians | 98.8 /100 | #94 | Exceptional 19.0% |
| Guamanians/Chamorros | 98.8 /100 | #95 | Exceptional 19.0% |
| Sierra Leoneans | 98.7 /100 | #96 | Exceptional 19.0% |
| Salvadorans | 98.4 /100 | #97 | Exceptional 19.1% |
| Immigrants | Jordan | 98.4 /100 | #98 | Exceptional 19.1% |
| Immigrants | Czechoslovakia | 98.3 /100 | #99 | Exceptional 19.1% |
| Chileans | 98.3 /100 | #100 | Exceptional 19.1% |
| Ecuadorians | 98.1 /100 | #101 | Exceptional 19.1% |
| Immigrants | Caribbean | 98.1 /100 | #102 | Exceptional 19.1% |
| Serbians | 98.0 /100 | #103 | Exceptional 19.1% |
| Immigrants | Afghanistan | 98.0 /100 | #104 | Exceptional 19.1% |
| Immigrants | Ecuador | 97.8 /100 | #105 | Exceptional 19.2% |
| Immigrants | Sierra Leone | 97.8 /100 | #106 | Exceptional 19.2% |
| Immigrants | Sri Lanka | 97.5 /100 | #107 | Exceptional 19.2% |
| Immigrants | Uzbekistan | 97.3 /100 | #108 | Exceptional 19.2% |