Finnish vs Iraqi Female Unemployment
COMPARE
Finnish
Iraqi
Female Unemployment
Female Unemployment Comparison
Finns
Iraqis
4.6%
FEMALE UNEMPLOYMENT
100.0/ 100
METRIC RATING
14th/ 347
METRIC RANK
5.5%
FEMALE UNEMPLOYMENT
7.1/ 100
METRIC RATING
224th/ 347
METRIC RANK
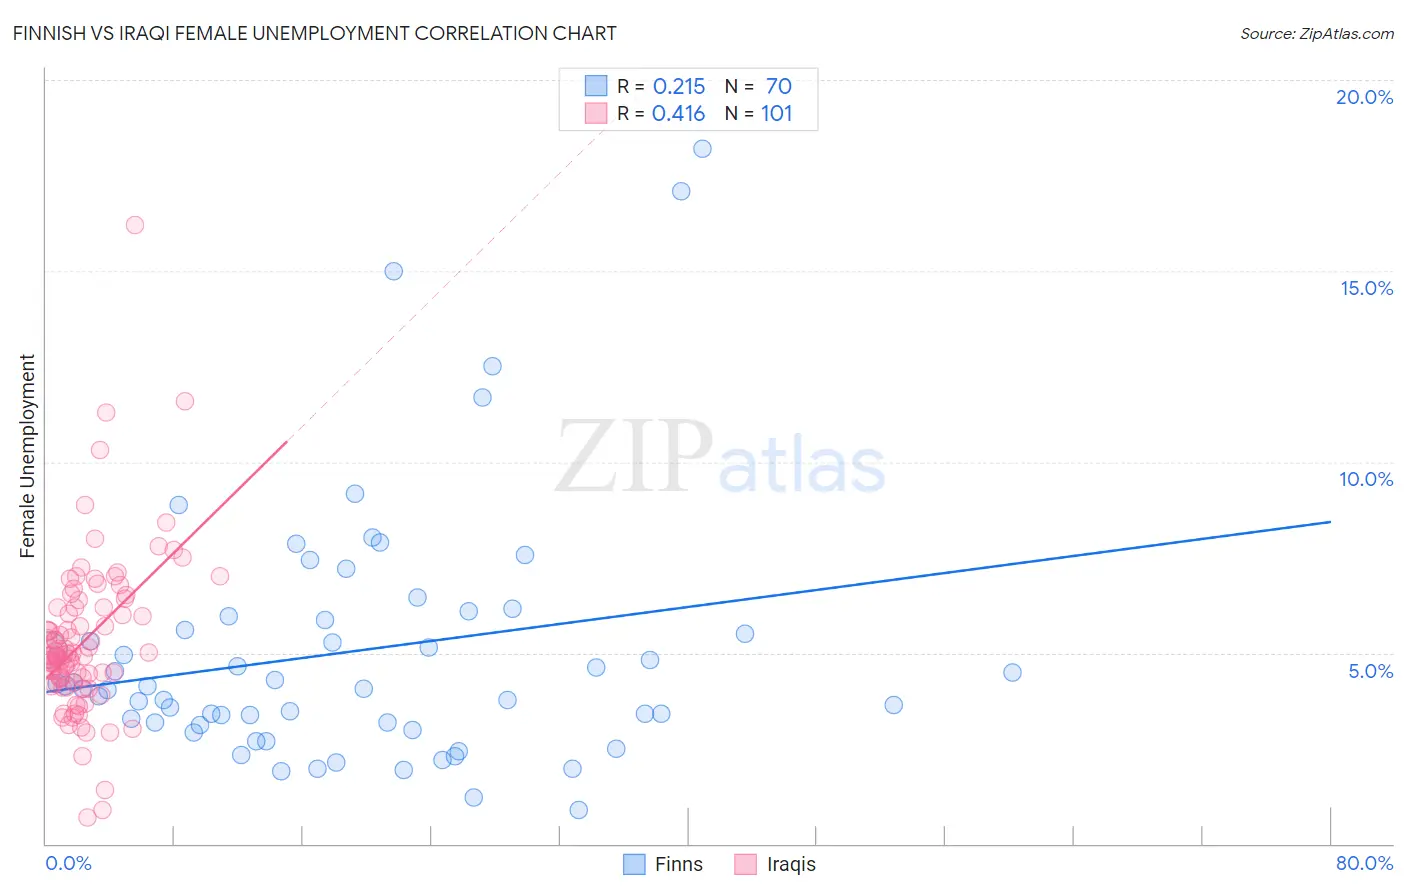
Finnish vs Iraqi Female Unemployment Correlation Chart
The statistical analysis conducted on geographies consisting of 401,070,094 people shows a weak positive correlation between the proportion of Finns and unemploymnet rate among females in the United States with a correlation coefficient (R) of 0.215 and weighted average of 4.6%. Similarly, the statistical analysis conducted on geographies consisting of 170,530,535 people shows a moderate positive correlation between the proportion of Iraqis and unemploymnet rate among females in the United States with a correlation coefficient (R) of 0.416 and weighted average of 5.5%, a difference of 18.1%.
Female Unemployment Correlation Summary
| Measurement | Finnish | Iraqi |
| Minimum | 0.90% | 0.70% |
| Maximum | 18.2% | 16.2% |
| Range | 17.3% | 15.5% |
| Mean | 5.0% | 5.3% |
| Median | 4.1% | 4.9% |
| Interquartile 25% (IQ1) | 3.2% | 4.3% |
| Interquartile 75% (IQ3) | 5.9% | 6.2% |
| Interquartile Range (IQR) | 2.7% | 1.9% |
| Standard Deviation (Sample) | 3.4% | 2.1% |
| Standard Deviation (Population) | 3.3% | 2.1% |
Similar Demographics by Female Unemployment
Demographics Similar to Finns by Female Unemployment
In terms of female unemployment, the demographic groups most similar to Finns are English (4.6%, a difference of 0.20%), Belgian (4.6%, a difference of 0.59%), Dutch (4.6%, a difference of 0.75%), Carpatho Rusyn (4.7%, a difference of 1.1%), and Croatian (4.7%, a difference of 1.1%).
| Demographics | Rating | Rank | Female Unemployment |
| Chinese | 100.0 /100 | #7 | Exceptional 4.5% |
| Germans | 100.0 /100 | #8 | Exceptional 4.5% |
| Slovenes | 100.0 /100 | #9 | Exceptional 4.5% |
| Swiss | 100.0 /100 | #10 | Exceptional 4.6% |
| Scandinavians | 100.0 /100 | #11 | Exceptional 4.6% |
| Dutch | 100.0 /100 | #12 | Exceptional 4.6% |
| Belgians | 100.0 /100 | #13 | Exceptional 4.6% |
| Finns | 100.0 /100 | #14 | Exceptional 4.6% |
| English | 100.0 /100 | #15 | Exceptional 4.6% |
| Carpatho Rusyns | 99.9 /100 | #16 | Exceptional 4.7% |
| Croatians | 99.9 /100 | #17 | Exceptional 4.7% |
| Latvians | 99.9 /100 | #18 | Exceptional 4.7% |
| Poles | 99.9 /100 | #19 | Exceptional 4.7% |
| Bulgarians | 99.9 /100 | #20 | Exceptional 4.7% |
| Fijians | 99.9 /100 | #21 | Exceptional 4.7% |
Demographics Similar to Iraqis by Female Unemployment
In terms of female unemployment, the demographic groups most similar to Iraqis are Delaware (5.5%, a difference of 0.030%), Nicaraguan (5.5%, a difference of 0.040%), Brazilian (5.5%, a difference of 0.060%), French American Indian (5.5%, a difference of 0.22%), and Immigrants from Peru (5.5%, a difference of 0.27%).
| Demographics | Rating | Rank | Female Unemployment |
| Peruvians | 9.6 /100 | #217 | Tragic 5.4% |
| Bermudans | 9.0 /100 | #218 | Tragic 5.4% |
| South Americans | 8.6 /100 | #219 | Tragic 5.4% |
| Immigrants | Africa | 8.5 /100 | #220 | Tragic 5.4% |
| Brazilians | 7.3 /100 | #221 | Tragic 5.5% |
| Nicaraguans | 7.2 /100 | #222 | Tragic 5.5% |
| Delaware | 7.2 /100 | #223 | Tragic 5.5% |
| Iraqis | 7.1 /100 | #224 | Tragic 5.5% |
| French American Indians | 6.1 /100 | #225 | Tragic 5.5% |
| Immigrants | Peru | 5.9 /100 | #226 | Tragic 5.5% |
| Immigrants | Philippines | 5.3 /100 | #227 | Tragic 5.5% |
| Israelis | 4.8 /100 | #228 | Tragic 5.5% |
| Panamanians | 4.7 /100 | #229 | Tragic 5.5% |
| Immigrants | Uruguay | 4.7 /100 | #230 | Tragic 5.5% |
| Immigrants | Iraq | 3.9 /100 | #231 | Tragic 5.5% |