Choctaw vs Vietnamese Unemployment Among Women with Children Ages 6 to 17 years
COMPARE
Choctaw
Vietnamese
Unemployment Among Women with Children Ages 6 to 17 years
Unemployment Among Women with Children Ages 6 to 17 years Comparison
Choctaw
Vietnamese
9.9%
UNEMPLOYMENT AMONG WOMEN WITH CHILDREN AGES 6 TO 17 YEARS
0.0/ 100
METRIC RATING
286th/ 347
METRIC RANK
8.9%
UNEMPLOYMENT AMONG WOMEN WITH CHILDREN AGES 6 TO 17 YEARS
72.1/ 100
METRIC RATING
154th/ 347
METRIC RANK
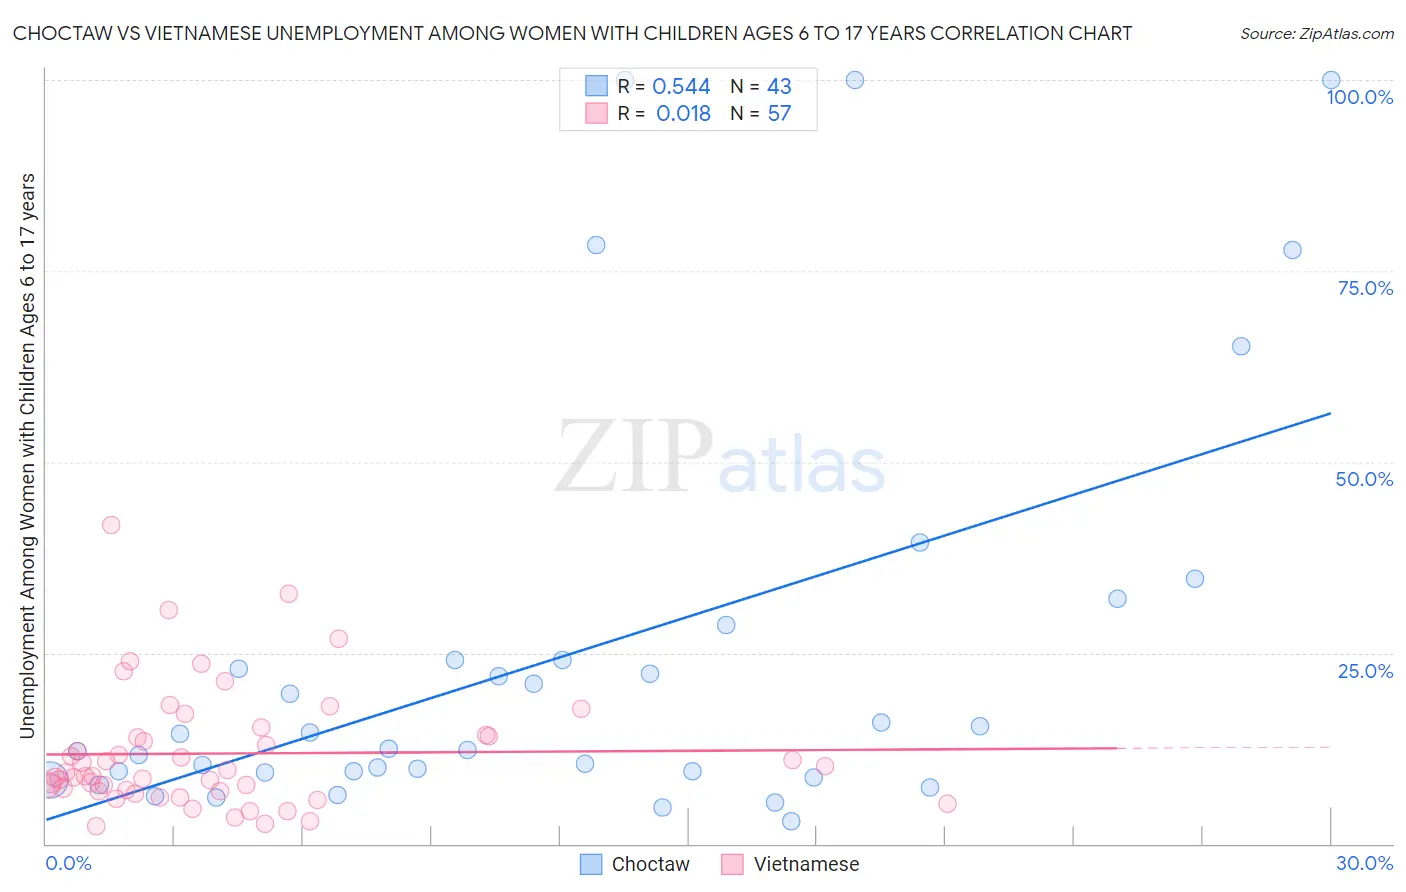
Choctaw vs Vietnamese Unemployment Among Women with Children Ages 6 to 17 years Correlation Chart
The statistical analysis conducted on geographies consisting of 208,938,346 people shows a substantial positive correlation between the proportion of Choctaw and unemployment rate among women with children between the ages 6 and 17 in the United States with a correlation coefficient (R) of 0.544 and weighted average of 9.9%. Similarly, the statistical analysis conducted on geographies consisting of 144,141,826 people shows no correlation between the proportion of Vietnamese and unemployment rate among women with children between the ages 6 and 17 in the United States with a correlation coefficient (R) of 0.018 and weighted average of 8.9%, a difference of 12.0%.
Unemployment Among Women with Children Ages 6 to 17 years Correlation Summary
| Measurement | Choctaw | Vietnamese |
| Minimum | 2.9% | 2.4% |
| Maximum | 100.0% | 41.7% |
| Range | 97.1% | 39.3% |
| Mean | 24.7% | 11.8% |
| Median | 12.5% | 8.8% |
| Interquartile 25% (IQ1) | 9.3% | 6.9% |
| Interquartile 75% (IQ3) | 24.1% | 14.2% |
| Interquartile Range (IQR) | 14.7% | 7.3% |
| Standard Deviation (Sample) | 27.1% | 7.9% |
| Standard Deviation (Population) | 26.8% | 7.9% |
Similar Demographics by Unemployment Among Women with Children Ages 6 to 17 years
Demographics Similar to Choctaw by Unemployment Among Women with Children Ages 6 to 17 years
In terms of unemployment among women with children ages 6 to 17 years, the demographic groups most similar to Choctaw are Sierra Leonean (9.9%, a difference of 0.050%), Hispanic or Latino (9.9%, a difference of 0.12%), Shoshone (10.0%, a difference of 0.29%), Yakama (9.9%, a difference of 0.43%), and Central American Indian (9.9%, a difference of 0.58%).
| Demographics | Rating | Rank | Unemployment Among Women with Children Ages 6 to 17 years |
| Scotch-Irish | 0.1 /100 | #279 | Tragic 9.7% |
| Seminole | 0.1 /100 | #280 | Tragic 9.7% |
| Jamaicans | 0.0 /100 | #281 | Tragic 9.8% |
| Slovaks | 0.0 /100 | #282 | Tragic 9.8% |
| Central American Indians | 0.0 /100 | #283 | Tragic 9.9% |
| Yakama | 0.0 /100 | #284 | Tragic 9.9% |
| Hispanics or Latinos | 0.0 /100 | #285 | Tragic 9.9% |
| Choctaw | 0.0 /100 | #286 | Tragic 9.9% |
| Sierra Leoneans | 0.0 /100 | #287 | Tragic 9.9% |
| Shoshone | 0.0 /100 | #288 | Tragic 10.0% |
| Hondurans | 0.0 /100 | #289 | Tragic 10.0% |
| Sub-Saharan Africans | 0.0 /100 | #290 | Tragic 10.0% |
| Immigrants | Nonimmigrants | 0.0 /100 | #291 | Tragic 10.0% |
| Carpatho Rusyns | 0.0 /100 | #292 | Tragic 10.0% |
| Haitians | 0.0 /100 | #293 | Tragic 10.0% |
Demographics Similar to Vietnamese by Unemployment Among Women with Children Ages 6 to 17 years
In terms of unemployment among women with children ages 6 to 17 years, the demographic groups most similar to Vietnamese are Immigrants from Greece (8.9%, a difference of 0.020%), Immigrants from Europe (8.9%, a difference of 0.070%), Immigrants from Eastern Africa (8.9%, a difference of 0.14%), Immigrants from Northern Europe (8.9%, a difference of 0.14%), and Greek (8.9%, a difference of 0.18%).
| Demographics | Rating | Rank | Unemployment Among Women with Children Ages 6 to 17 years |
| Immigrants | Bangladesh | 79.4 /100 | #147 | Good 8.8% |
| Costa Ricans | 77.0 /100 | #148 | Good 8.8% |
| Croatians | 76.0 /100 | #149 | Good 8.8% |
| Greeks | 75.2 /100 | #150 | Good 8.9% |
| Immigrants | Eastern Africa | 74.6 /100 | #151 | Good 8.9% |
| Immigrants | Northern Europe | 74.6 /100 | #152 | Good 8.9% |
| Immigrants | Europe | 73.4 /100 | #153 | Good 8.9% |
| Vietnamese | 72.1 /100 | #154 | Good 8.9% |
| Immigrants | Greece | 71.8 /100 | #155 | Good 8.9% |
| Osage | 65.9 /100 | #156 | Good 8.9% |
| Immigrants | Belgium | 65.6 /100 | #157 | Good 8.9% |
| Immigrants | Chile | 65.3 /100 | #158 | Good 8.9% |
| Spanish | 63.8 /100 | #159 | Good 8.9% |
| Immigrants | Hungary | 63.4 /100 | #160 | Good 8.9% |
| Immigrants | Guyana | 63.0 /100 | #161 | Good 8.9% |