Choctaw vs Senegalese Unemployment Among Women with Children Ages 6 to 17 years
COMPARE
Choctaw
Senegalese
Unemployment Among Women with Children Ages 6 to 17 years
Unemployment Among Women with Children Ages 6 to 17 years Comparison
Choctaw
Senegalese
9.9%
UNEMPLOYMENT AMONG WOMEN WITH CHILDREN AGES 6 TO 17 YEARS
0.0/ 100
METRIC RATING
286th/ 347
METRIC RANK
9.5%
UNEMPLOYMENT AMONG WOMEN WITH CHILDREN AGES 6 TO 17 YEARS
0.5/ 100
METRIC RATING
262nd/ 347
METRIC RANK
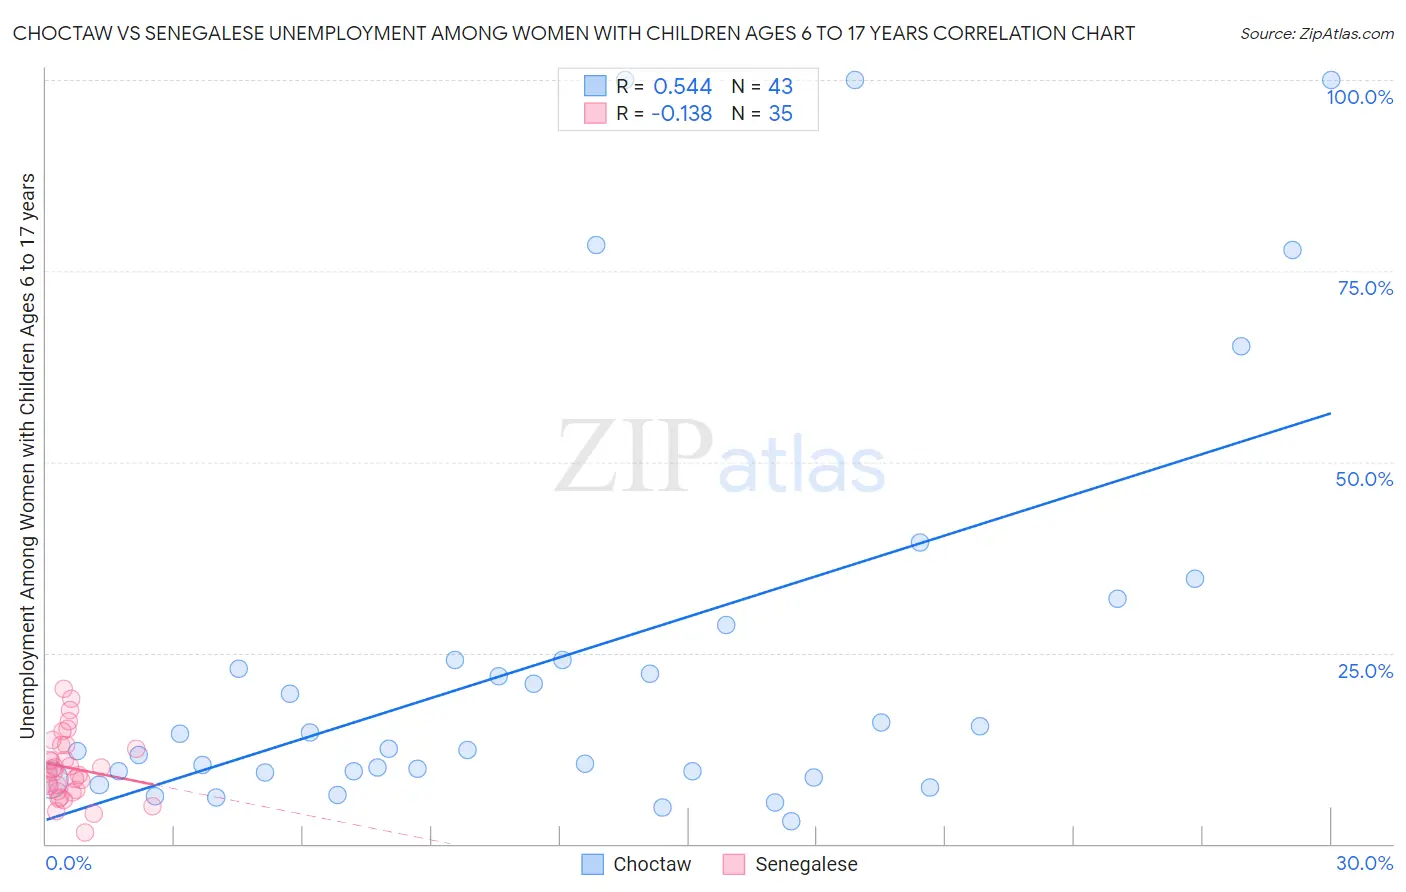
Choctaw vs Senegalese Unemployment Among Women with Children Ages 6 to 17 years Correlation Chart
The statistical analysis conducted on geographies consisting of 208,938,346 people shows a substantial positive correlation between the proportion of Choctaw and unemployment rate among women with children between the ages 6 and 17 in the United States with a correlation coefficient (R) of 0.544 and weighted average of 9.9%. Similarly, the statistical analysis conducted on geographies consisting of 70,256,082 people shows a poor negative correlation between the proportion of Senegalese and unemployment rate among women with children between the ages 6 and 17 in the United States with a correlation coefficient (R) of -0.138 and weighted average of 9.5%, a difference of 4.6%.
Unemployment Among Women with Children Ages 6 to 17 years Correlation Summary
| Measurement | Choctaw | Senegalese |
| Minimum | 2.9% | 1.4% |
| Maximum | 100.0% | 20.2% |
| Range | 97.1% | 18.8% |
| Mean | 24.7% | 9.9% |
| Median | 12.5% | 9.3% |
| Interquartile 25% (IQ1) | 9.3% | 6.8% |
| Interquartile 75% (IQ3) | 24.1% | 12.9% |
| Interquartile Range (IQR) | 14.7% | 6.1% |
| Standard Deviation (Sample) | 27.1% | 4.3% |
| Standard Deviation (Population) | 26.8% | 4.3% |
Similar Demographics by Unemployment Among Women with Children Ages 6 to 17 years
Demographics Similar to Choctaw by Unemployment Among Women with Children Ages 6 to 17 years
In terms of unemployment among women with children ages 6 to 17 years, the demographic groups most similar to Choctaw are Sierra Leonean (9.9%, a difference of 0.050%), Hispanic or Latino (9.9%, a difference of 0.12%), Shoshone (10.0%, a difference of 0.29%), Yakama (9.9%, a difference of 0.43%), and Central American Indian (9.9%, a difference of 0.58%).
| Demographics | Rating | Rank | Unemployment Among Women with Children Ages 6 to 17 years |
| Scotch-Irish | 0.1 /100 | #279 | Tragic 9.7% |
| Seminole | 0.1 /100 | #280 | Tragic 9.7% |
| Jamaicans | 0.0 /100 | #281 | Tragic 9.8% |
| Slovaks | 0.0 /100 | #282 | Tragic 9.8% |
| Central American Indians | 0.0 /100 | #283 | Tragic 9.9% |
| Yakama | 0.0 /100 | #284 | Tragic 9.9% |
| Hispanics or Latinos | 0.0 /100 | #285 | Tragic 9.9% |
| Choctaw | 0.0 /100 | #286 | Tragic 9.9% |
| Sierra Leoneans | 0.0 /100 | #287 | Tragic 9.9% |
| Shoshone | 0.0 /100 | #288 | Tragic 10.0% |
| Hondurans | 0.0 /100 | #289 | Tragic 10.0% |
| Sub-Saharan Africans | 0.0 /100 | #290 | Tragic 10.0% |
| Immigrants | Nonimmigrants | 0.0 /100 | #291 | Tragic 10.0% |
| Carpatho Rusyns | 0.0 /100 | #292 | Tragic 10.0% |
| Haitians | 0.0 /100 | #293 | Tragic 10.0% |
Demographics Similar to Senegalese by Unemployment Among Women with Children Ages 6 to 17 years
In terms of unemployment among women with children ages 6 to 17 years, the demographic groups most similar to Senegalese are Lebanese (9.5%, a difference of 0.040%), South American (9.5%, a difference of 0.050%), Italian (9.5%, a difference of 0.14%), Immigrants from Central America (9.5%, a difference of 0.25%), and Immigrants from Ghana (9.5%, a difference of 0.28%).
| Demographics | Rating | Rank | Unemployment Among Women with Children Ages 6 to 17 years |
| Lithuanians | 0.9 /100 | #255 | Tragic 9.4% |
| Canadians | 0.8 /100 | #256 | Tragic 9.4% |
| Celtics | 0.7 /100 | #257 | Tragic 9.5% |
| Immigrants | Mexico | 0.7 /100 | #258 | Tragic 9.5% |
| Immigrants | Central America | 0.6 /100 | #259 | Tragic 9.5% |
| Italians | 0.6 /100 | #260 | Tragic 9.5% |
| South Americans | 0.5 /100 | #261 | Tragic 9.5% |
| Senegalese | 0.5 /100 | #262 | Tragic 9.5% |
| Lebanese | 0.5 /100 | #263 | Tragic 9.5% |
| Immigrants | Ghana | 0.4 /100 | #264 | Tragic 9.5% |
| West Indians | 0.4 /100 | #265 | Tragic 9.5% |
| Immigrants | Jamaica | 0.3 /100 | #266 | Tragic 9.5% |
| Irish | 0.3 /100 | #267 | Tragic 9.5% |
| Ghanaians | 0.2 /100 | #268 | Tragic 9.6% |
| Blackfeet | 0.2 /100 | #269 | Tragic 9.6% |