Immigrants from Lebanon vs Native/Alaskan Female Unemployment
COMPARE
Immigrants from Lebanon
Native/Alaskan
Female Unemployment
Female Unemployment Comparison
Immigrants from Lebanon
Natives/Alaskans
5.5%
FEMALE UNEMPLOYMENT
3.3/ 100
METRIC RATING
234th/ 347
METRIC RANK
6.6%
FEMALE UNEMPLOYMENT
0.0/ 100
METRIC RATING
326th/ 347
METRIC RANK
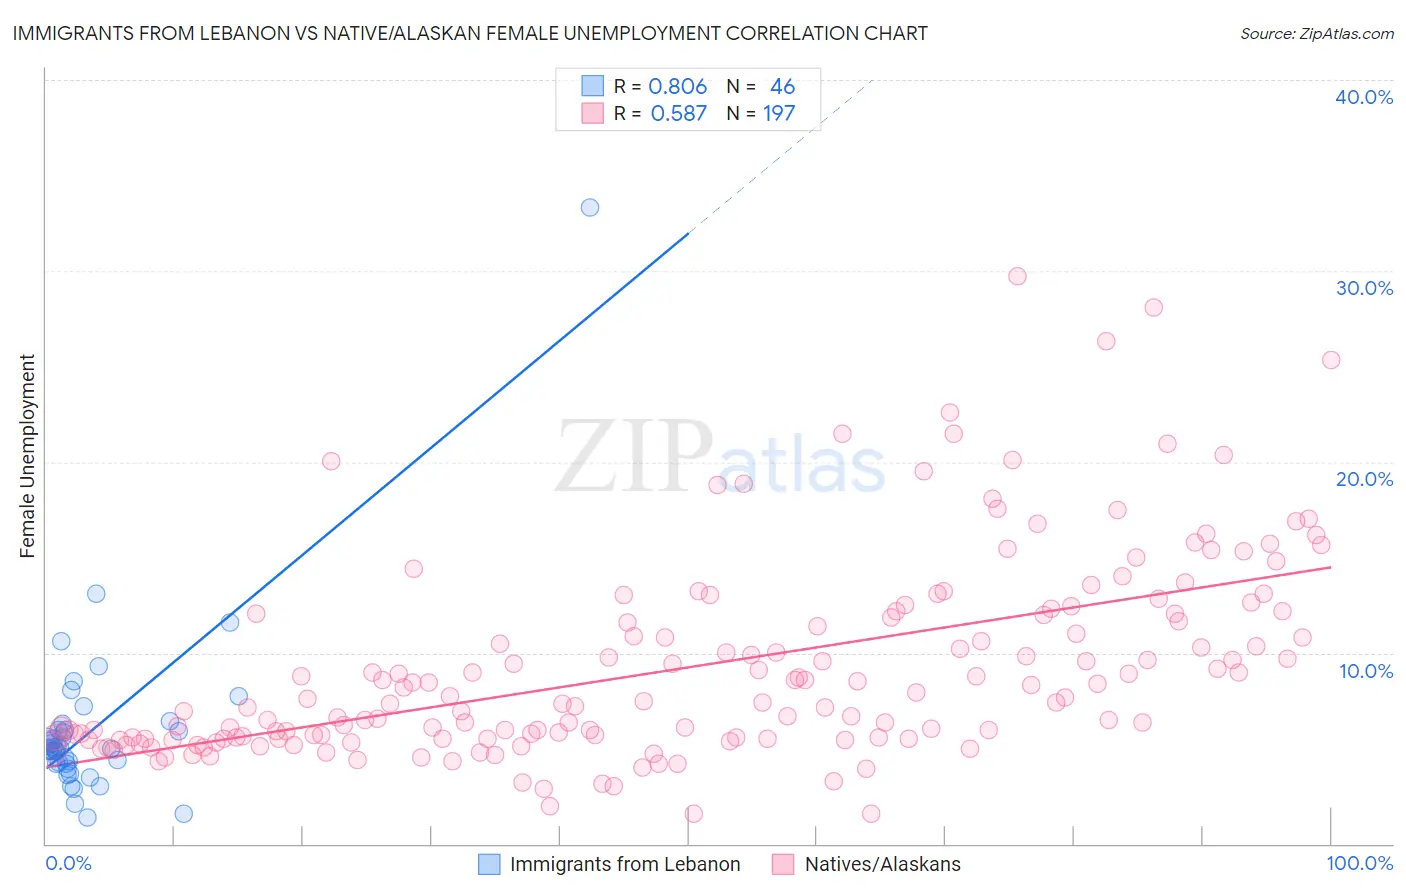
Immigrants from Lebanon vs Native/Alaskan Female Unemployment Correlation Chart
The statistical analysis conducted on geographies consisting of 216,922,483 people shows a very strong positive correlation between the proportion of Immigrants from Lebanon and unemploymnet rate among females in the United States with a correlation coefficient (R) of 0.806 and weighted average of 5.5%. Similarly, the statistical analysis conducted on geographies consisting of 506,227,982 people shows a substantial positive correlation between the proportion of Natives/Alaskans and unemploymnet rate among females in the United States with a correlation coefficient (R) of 0.587 and weighted average of 6.6%, a difference of 20.0%.
Female Unemployment Correlation Summary
| Measurement | Immigrants from Lebanon | Native/Alaskan |
| Minimum | 1.4% | 1.6% |
| Maximum | 33.3% | 29.7% |
| Range | 31.9% | 28.1% |
| Mean | 6.0% | 9.2% |
| Median | 5.0% | 7.5% |
| Interquartile 25% (IQ1) | 4.2% | 5.5% |
| Interquartile 75% (IQ3) | 6.0% | 12.0% |
| Interquartile Range (IQR) | 1.8% | 6.5% |
| Standard Deviation (Sample) | 4.7% | 5.2% |
| Standard Deviation (Population) | 4.7% | 5.2% |
Similar Demographics by Female Unemployment
Demographics Similar to Immigrants from Lebanon by Female Unemployment
In terms of female unemployment, the demographic groups most similar to Immigrants from Lebanon are Immigrants from Iran (5.5%, a difference of 0.0%), Moroccan (5.5%, a difference of 0.020%), Immigrants from Cambodia (5.5%, a difference of 0.040%), Immigrants from Panama (5.5%, a difference of 0.060%), and Sierra Leonean (5.5%, a difference of 0.080%).
| Demographics | Rating | Rank | Female Unemployment |
| Immigrants | Philippines | 5.3 /100 | #227 | Tragic 5.5% |
| Israelis | 4.8 /100 | #228 | Tragic 5.5% |
| Panamanians | 4.7 /100 | #229 | Tragic 5.5% |
| Immigrants | Uruguay | 4.7 /100 | #230 | Tragic 5.5% |
| Immigrants | Iraq | 3.9 /100 | #231 | Tragic 5.5% |
| Liberians | 3.9 /100 | #232 | Tragic 5.5% |
| Moroccans | 3.4 /100 | #233 | Tragic 5.5% |
| Immigrants | Lebanon | 3.3 /100 | #234 | Tragic 5.5% |
| Immigrants | Iran | 3.3 /100 | #235 | Tragic 5.5% |
| Immigrants | Cambodia | 3.3 /100 | #236 | Tragic 5.5% |
| Immigrants | Panama | 3.2 /100 | #237 | Tragic 5.5% |
| Sierra Leoneans | 3.2 /100 | #238 | Tragic 5.5% |
| Aleuts | 3.0 /100 | #239 | Tragic 5.5% |
| Immigrants | South America | 2.9 /100 | #240 | Tragic 5.5% |
| South American Indians | 2.8 /100 | #241 | Tragic 5.5% |
Demographics Similar to Natives/Alaskans by Female Unemployment
In terms of female unemployment, the demographic groups most similar to Natives/Alaskans are Alaska Native (6.6%, a difference of 0.090%), Guyanese (6.7%, a difference of 0.52%), Apache (6.6%, a difference of 0.56%), Cheyenne (6.6%, a difference of 0.83%), and Immigrants from Guyana (6.7%, a difference of 0.89%).
| Demographics | Rating | Rank | Female Unemployment |
| Immigrants | Bangladesh | 0.0 /100 | #319 | Tragic 6.5% |
| Immigrants | Dominica | 0.0 /100 | #320 | Tragic 6.5% |
| Blacks/African Americans | 0.0 /100 | #321 | Tragic 6.5% |
| Vietnamese | 0.0 /100 | #322 | Tragic 6.5% |
| Immigrants | Belize | 0.0 /100 | #323 | Tragic 6.5% |
| Cheyenne | 0.0 /100 | #324 | Tragic 6.6% |
| Apache | 0.0 /100 | #325 | Tragic 6.6% |
| Natives/Alaskans | 0.0 /100 | #326 | Tragic 6.6% |
| Alaska Natives | 0.0 /100 | #327 | Tragic 6.6% |
| Guyanese | 0.0 /100 | #328 | Tragic 6.7% |
| Immigrants | Guyana | 0.0 /100 | #329 | Tragic 6.7% |
| Yakama | 0.0 /100 | #330 | Tragic 6.7% |
| Paiute | 0.0 /100 | #331 | Tragic 6.8% |
| Sioux | 0.0 /100 | #332 | Tragic 7.0% |
| Menominee | 0.0 /100 | #333 | Tragic 7.0% |