Chickasaw vs Trinidadian and Tobagonian Male Unemployment
COMPARE
Chickasaw
Trinidadian and Tobagonian
Male Unemployment
Male Unemployment Comparison
Chickasaw
Trinidadians and Tobagonians
5.2%
MALE UNEMPLOYMENT
82.9/ 100
METRIC RATING
132nd/ 347
METRIC RANK
6.7%
MALE UNEMPLOYMENT
0.0/ 100
METRIC RATING
305th/ 347
METRIC RANK
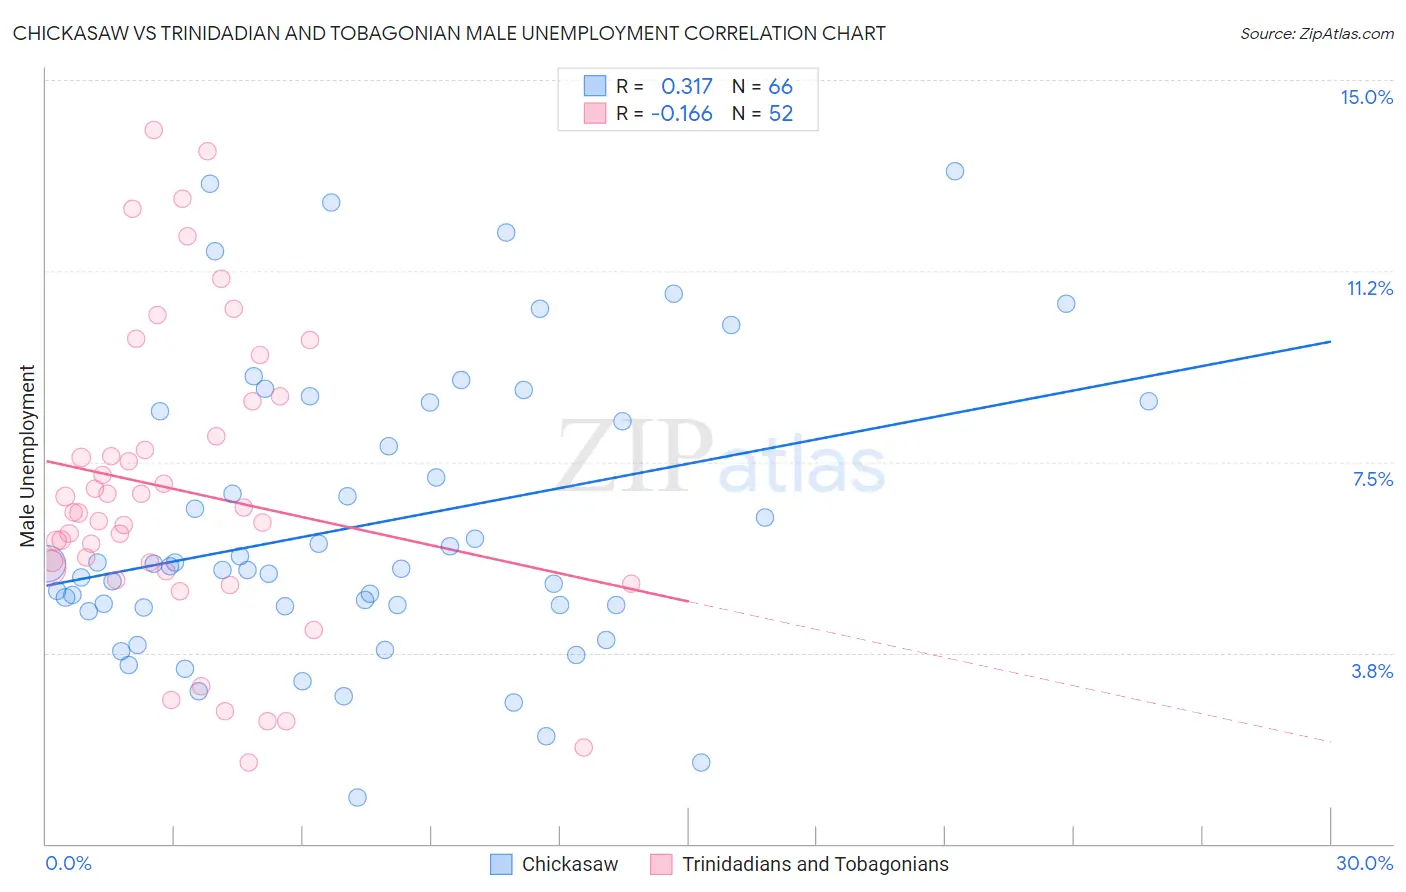
Chickasaw vs Trinidadian and Tobagonian Male Unemployment Correlation Chart
The statistical analysis conducted on geographies consisting of 147,341,260 people shows a mild positive correlation between the proportion of Chickasaw and unemployment rate among males in the United States with a correlation coefficient (R) of 0.317 and weighted average of 5.2%. Similarly, the statistical analysis conducted on geographies consisting of 219,443,650 people shows a poor negative correlation between the proportion of Trinidadians and Tobagonians and unemployment rate among males in the United States with a correlation coefficient (R) of -0.166 and weighted average of 6.7%, a difference of 29.2%.
Male Unemployment Correlation Summary
| Measurement | Chickasaw | Trinidadian and Tobagonian |
| Minimum | 0.90% | 1.6% |
| Maximum | 13.2% | 14.0% |
| Range | 12.3% | 12.4% |
| Mean | 6.3% | 6.9% |
| Median | 5.4% | 6.5% |
| Interquartile 25% (IQ1) | 4.7% | 5.4% |
| Interquartile 75% (IQ3) | 8.5% | 8.4% |
| Interquartile Range (IQR) | 3.8% | 3.0% |
| Standard Deviation (Sample) | 2.8% | 2.9% |
| Standard Deviation (Population) | 2.8% | 2.9% |
Similar Demographics by Male Unemployment
Demographics Similar to Chickasaw by Male Unemployment
In terms of male unemployment, the demographic groups most similar to Chickasaw are Immigrants from Germany (5.2%, a difference of 0.020%), Immigrants from Malaysia (5.2%, a difference of 0.070%), Colombian (5.2%, a difference of 0.18%), Immigrants from Western Europe (5.2%, a difference of 0.21%), and Pakistani (5.2%, a difference of 0.24%).
| Demographics | Rating | Rank | Male Unemployment |
| Immigrants | Lithuania | 87.2 /100 | #125 | Excellent 5.1% |
| Immigrants | Colombia | 86.8 /100 | #126 | Excellent 5.1% |
| Immigrants | Brazil | 86.3 /100 | #127 | Excellent 5.2% |
| Hungarians | 85.1 /100 | #128 | Excellent 5.2% |
| Immigrants | Western Europe | 84.8 /100 | #129 | Excellent 5.2% |
| Immigrants | Malaysia | 83.5 /100 | #130 | Excellent 5.2% |
| Immigrants | Germany | 83.0 /100 | #131 | Excellent 5.2% |
| Chickasaw | 82.9 /100 | #132 | Excellent 5.2% |
| Colombians | 81.1 /100 | #133 | Excellent 5.2% |
| Pakistanis | 80.5 /100 | #134 | Excellent 5.2% |
| Immigrants | Saudi Arabia | 80.1 /100 | #135 | Excellent 5.2% |
| Lebanese | 79.9 /100 | #136 | Good 5.2% |
| Immigrants | Eastern Africa | 79.8 /100 | #137 | Good 5.2% |
| Immigrants | Croatia | 79.7 /100 | #138 | Good 5.2% |
| Kenyans | 79.4 /100 | #139 | Good 5.2% |
Demographics Similar to Trinidadians and Tobagonians by Male Unemployment
In terms of male unemployment, the demographic groups most similar to Trinidadians and Tobagonians are Immigrants from Trinidad and Tobago (6.7%, a difference of 0.20%), Immigrants from Jamaica (6.7%, a difference of 0.28%), Immigrants from West Indies (6.7%, a difference of 0.32%), West Indian (6.7%, a difference of 0.32%), and Ute (6.6%, a difference of 0.69%).
| Demographics | Rating | Rank | Male Unemployment |
| Jamaicans | 0.0 /100 | #298 | Tragic 6.6% |
| Immigrants | Bangladesh | 0.0 /100 | #299 | Tragic 6.6% |
| Vietnamese | 0.0 /100 | #300 | Tragic 6.6% |
| Immigrants | Belize | 0.0 /100 | #301 | Tragic 6.6% |
| Ute | 0.0 /100 | #302 | Tragic 6.6% |
| Immigrants | West Indies | 0.0 /100 | #303 | Tragic 6.7% |
| West Indians | 0.0 /100 | #304 | Tragic 6.7% |
| Trinidadians and Tobagonians | 0.0 /100 | #305 | Tragic 6.7% |
| Immigrants | Trinidad and Tobago | 0.0 /100 | #306 | Tragic 6.7% |
| Immigrants | Jamaica | 0.0 /100 | #307 | Tragic 6.7% |
| Aleuts | 0.0 /100 | #308 | Tragic 6.8% |
| Barbadians | 0.0 /100 | #309 | Tragic 6.9% |
| Blacks/African Americans | 0.0 /100 | #310 | Tragic 6.9% |
| Immigrants | Armenia | 0.0 /100 | #311 | Tragic 6.9% |
| Lumbee | 0.0 /100 | #312 | Tragic 6.9% |