Immigrants from Haiti vs Trinidadian and Tobagonian Male Unemployment
COMPARE
Immigrants from Haiti
Trinidadian and Tobagonian
Male Unemployment
Male Unemployment Comparison
Immigrants from Haiti
Trinidadians and Tobagonians
6.5%
MALE UNEMPLOYMENT
0.0/ 100
METRIC RATING
296th/ 347
METRIC RANK
6.7%
MALE UNEMPLOYMENT
0.0/ 100
METRIC RATING
305th/ 347
METRIC RANK
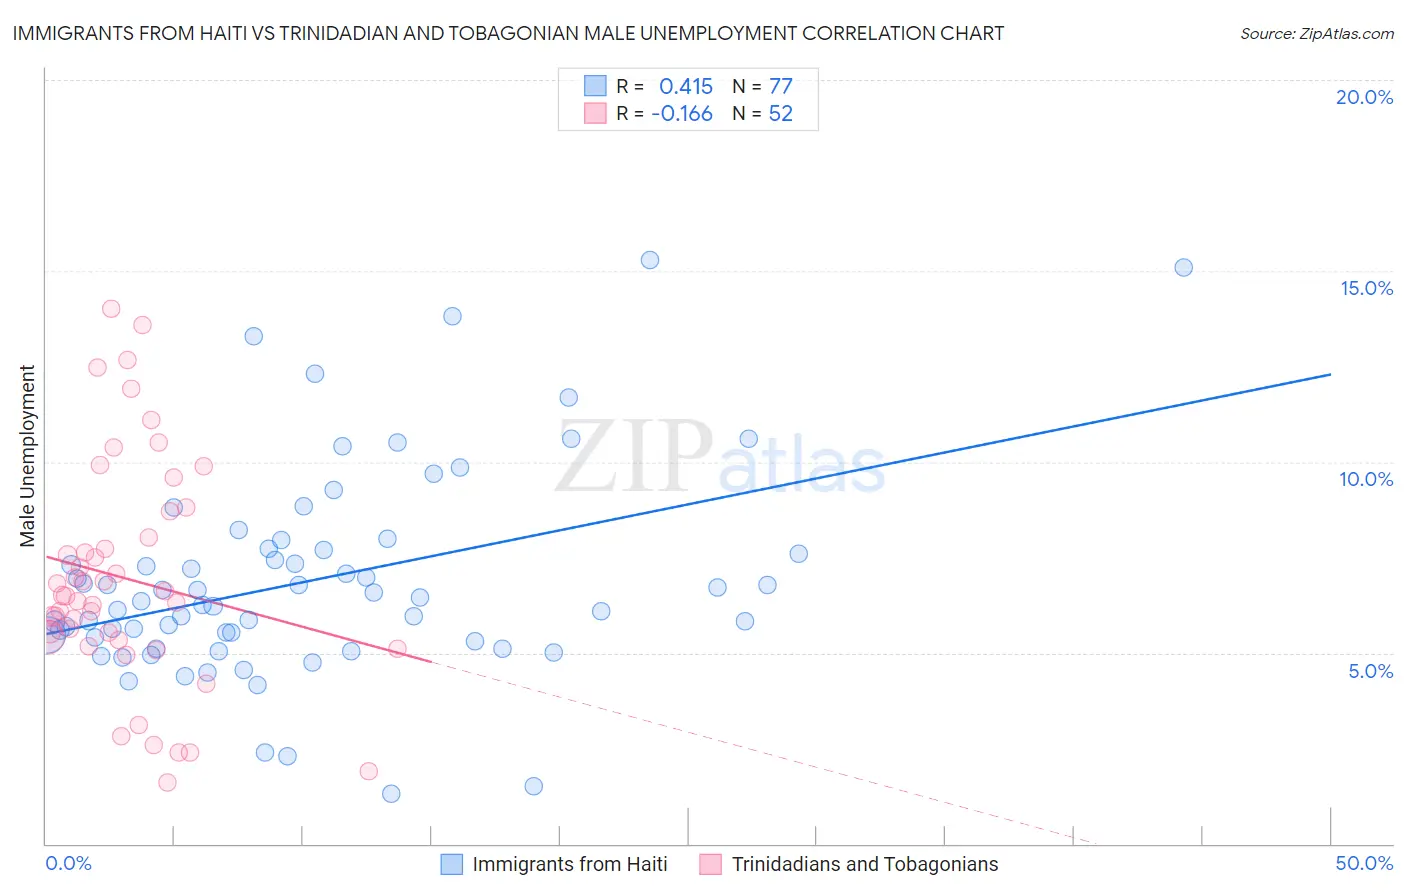
Immigrants from Haiti vs Trinidadian and Tobagonian Male Unemployment Correlation Chart
The statistical analysis conducted on geographies consisting of 224,769,713 people shows a moderate positive correlation between the proportion of Immigrants from Haiti and unemployment rate among males in the United States with a correlation coefficient (R) of 0.415 and weighted average of 6.5%. Similarly, the statistical analysis conducted on geographies consisting of 219,443,650 people shows a poor negative correlation between the proportion of Trinidadians and Tobagonians and unemployment rate among males in the United States with a correlation coefficient (R) of -0.166 and weighted average of 6.7%, a difference of 2.3%.
Male Unemployment Correlation Summary
| Measurement | Immigrants from Haiti | Trinidadian and Tobagonian |
| Minimum | 1.3% | 1.6% |
| Maximum | 15.3% | 14.0% |
| Range | 14.0% | 12.4% |
| Mean | 6.9% | 6.9% |
| Median | 6.3% | 6.5% |
| Interquartile 25% (IQ1) | 5.3% | 5.4% |
| Interquartile 75% (IQ3) | 7.7% | 8.4% |
| Interquartile Range (IQR) | 2.4% | 3.0% |
| Standard Deviation (Sample) | 2.7% | 2.9% |
| Standard Deviation (Population) | 2.7% | 2.9% |
Demographics Similar to Immigrants from Haiti and Trinidadians and Tobagonians by Male Unemployment
In terms of male unemployment, the demographic groups most similar to Immigrants from Haiti are Chippewa (6.6%, a difference of 0.32%), Jamaican (6.6%, a difference of 0.40%), Belizean (6.5%, a difference of 0.45%), Immigrants from Bangladesh (6.6%, a difference of 0.53%), and Vietnamese (6.6%, a difference of 0.80%). Similarly, the demographic groups most similar to Trinidadians and Tobagonians are Immigrants from Trinidad and Tobago (6.7%, a difference of 0.20%), Immigrants from Jamaica (6.7%, a difference of 0.28%), Immigrants from West Indies (6.7%, a difference of 0.32%), West Indian (6.7%, a difference of 0.32%), and Ute (6.6%, a difference of 0.69%).
| Demographics | Rating | Rank | Male Unemployment |
| U.S. Virgin Islanders | 0.0 /100 | #290 | Tragic 6.4% |
| Immigrants | Azores | 0.0 /100 | #291 | Tragic 6.4% |
| Nepalese | 0.0 /100 | #292 | Tragic 6.4% |
| Haitians | 0.0 /100 | #293 | Tragic 6.4% |
| Senegalese | 0.0 /100 | #294 | Tragic 6.4% |
| Belizeans | 0.0 /100 | #295 | Tragic 6.5% |
| Immigrants | Haiti | 0.0 /100 | #296 | Tragic 6.5% |
| Chippewa | 0.0 /100 | #297 | Tragic 6.6% |
| Jamaicans | 0.0 /100 | #298 | Tragic 6.6% |
| Immigrants | Bangladesh | 0.0 /100 | #299 | Tragic 6.6% |
| Vietnamese | 0.0 /100 | #300 | Tragic 6.6% |
| Immigrants | Belize | 0.0 /100 | #301 | Tragic 6.6% |
| Ute | 0.0 /100 | #302 | Tragic 6.6% |
| Immigrants | West Indies | 0.0 /100 | #303 | Tragic 6.7% |
| West Indians | 0.0 /100 | #304 | Tragic 6.7% |
| Trinidadians and Tobagonians | 0.0 /100 | #305 | Tragic 6.7% |
| Immigrants | Trinidad and Tobago | 0.0 /100 | #306 | Tragic 6.7% |
| Immigrants | Jamaica | 0.0 /100 | #307 | Tragic 6.7% |
| Aleuts | 0.0 /100 | #308 | Tragic 6.8% |
| Barbadians | 0.0 /100 | #309 | Tragic 6.9% |
| Blacks/African Americans | 0.0 /100 | #310 | Tragic 6.9% |