Czechoslovakian vs Trinidadian and Tobagonian Male Unemployment
COMPARE
Czechoslovakian
Trinidadian and Tobagonian
Male Unemployment
Male Unemployment Comparison
Czechoslovakians
Trinidadians and Tobagonians
5.0%
MALE UNEMPLOYMENT
98.7/ 100
METRIC RATING
55th/ 347
METRIC RANK
6.7%
MALE UNEMPLOYMENT
0.0/ 100
METRIC RATING
305th/ 347
METRIC RANK
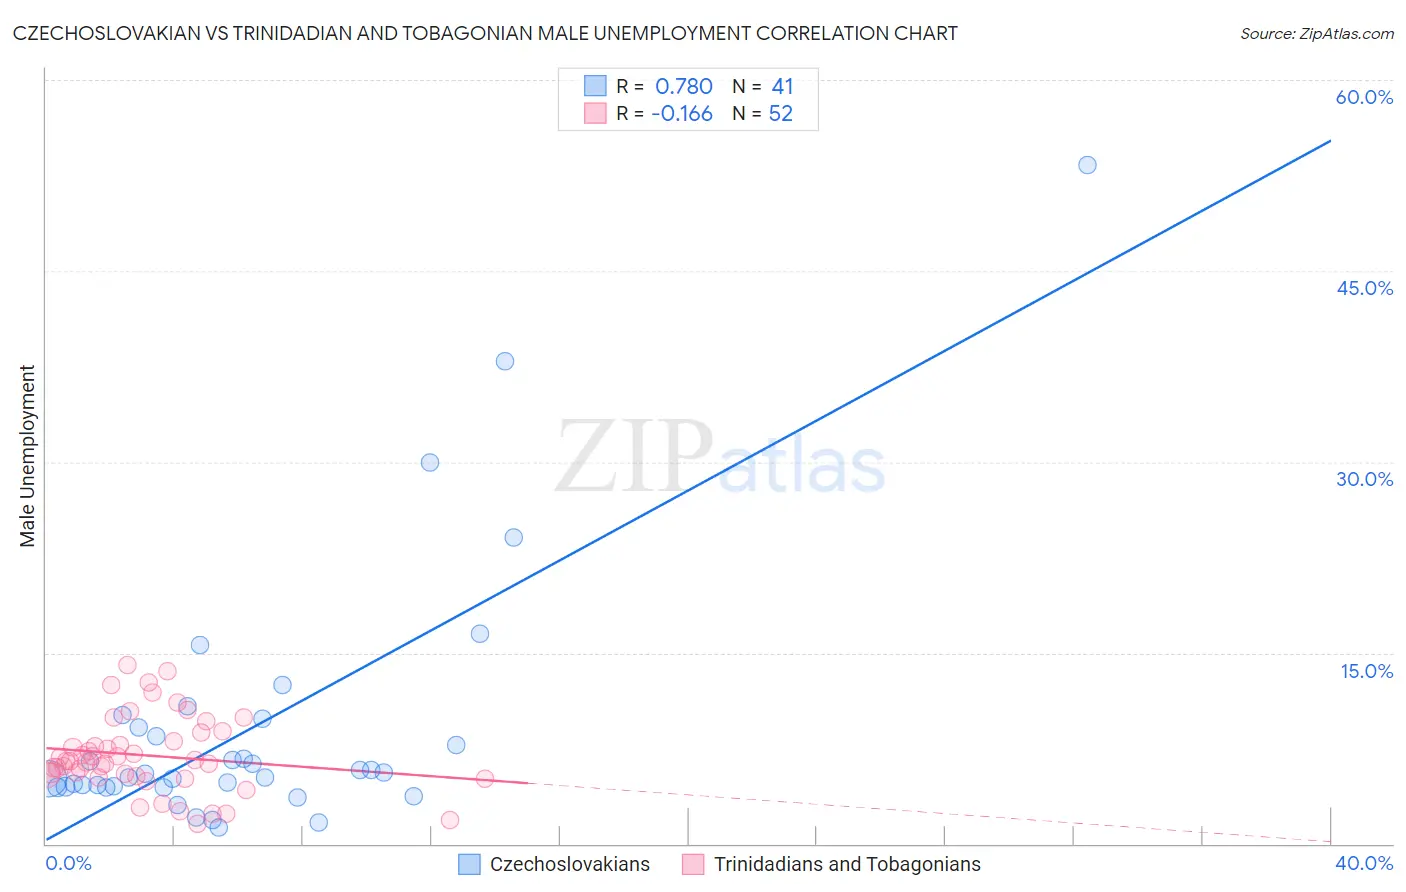
Czechoslovakian vs Trinidadian and Tobagonian Male Unemployment Correlation Chart
The statistical analysis conducted on geographies consisting of 366,692,431 people shows a strong positive correlation between the proportion of Czechoslovakians and unemployment rate among males in the United States with a correlation coefficient (R) of 0.780 and weighted average of 5.0%. Similarly, the statistical analysis conducted on geographies consisting of 219,443,650 people shows a poor negative correlation between the proportion of Trinidadians and Tobagonians and unemployment rate among males in the United States with a correlation coefficient (R) of -0.166 and weighted average of 6.7%, a difference of 34.7%.
Male Unemployment Correlation Summary
| Measurement | Czechoslovakian | Trinidadian and Tobagonian |
| Minimum | 1.3% | 1.6% |
| Maximum | 53.3% | 14.0% |
| Range | 52.0% | 12.4% |
| Mean | 9.1% | 6.9% |
| Median | 5.5% | 6.5% |
| Interquartile 25% (IQ1) | 4.5% | 5.4% |
| Interquartile 75% (IQ3) | 9.5% | 8.4% |
| Interquartile Range (IQR) | 5.1% | 3.0% |
| Standard Deviation (Sample) | 10.2% | 2.9% |
| Standard Deviation (Population) | 10.1% | 2.9% |
Similar Demographics by Male Unemployment
Demographics Similar to Czechoslovakians by Male Unemployment
In terms of male unemployment, the demographic groups most similar to Czechoslovakians are Yugoslavian (5.0%, a difference of 0.0%), Immigrants from Bulgaria (5.0%, a difference of 0.0%), Jordanian (5.0%, a difference of 0.11%), Irish (5.0%, a difference of 0.17%), and Slovene (5.0%, a difference of 0.19%).
| Demographics | Rating | Rank | Male Unemployment |
| Immigrants | Scotland | 98.9 /100 | #48 | Exceptional 4.9% |
| Poles | 98.9 /100 | #49 | Exceptional 4.9% |
| Croatians | 98.9 /100 | #50 | Exceptional 4.9% |
| Slovenes | 98.8 /100 | #51 | Exceptional 5.0% |
| Irish | 98.8 /100 | #52 | Exceptional 5.0% |
| Jordanians | 98.8 /100 | #53 | Exceptional 5.0% |
| Yugoslavians | 98.7 /100 | #54 | Exceptional 5.0% |
| Czechoslovakians | 98.7 /100 | #55 | Exceptional 5.0% |
| Immigrants | Bulgaria | 98.7 /100 | #56 | Exceptional 5.0% |
| Turks | 98.5 /100 | #57 | Exceptional 5.0% |
| Lithuanians | 98.5 /100 | #58 | Exceptional 5.0% |
| Immigrants | Netherlands | 98.3 /100 | #59 | Exceptional 5.0% |
| Immigrants | Argentina | 98.1 /100 | #60 | Exceptional 5.0% |
| Cambodians | 98.1 /100 | #61 | Exceptional 5.0% |
| Basques | 97.9 /100 | #62 | Exceptional 5.0% |
Demographics Similar to Trinidadians and Tobagonians by Male Unemployment
In terms of male unemployment, the demographic groups most similar to Trinidadians and Tobagonians are Immigrants from Trinidad and Tobago (6.7%, a difference of 0.20%), Immigrants from Jamaica (6.7%, a difference of 0.28%), Immigrants from West Indies (6.7%, a difference of 0.32%), West Indian (6.7%, a difference of 0.32%), and Ute (6.6%, a difference of 0.69%).
| Demographics | Rating | Rank | Male Unemployment |
| Jamaicans | 0.0 /100 | #298 | Tragic 6.6% |
| Immigrants | Bangladesh | 0.0 /100 | #299 | Tragic 6.6% |
| Vietnamese | 0.0 /100 | #300 | Tragic 6.6% |
| Immigrants | Belize | 0.0 /100 | #301 | Tragic 6.6% |
| Ute | 0.0 /100 | #302 | Tragic 6.6% |
| Immigrants | West Indies | 0.0 /100 | #303 | Tragic 6.7% |
| West Indians | 0.0 /100 | #304 | Tragic 6.7% |
| Trinidadians and Tobagonians | 0.0 /100 | #305 | Tragic 6.7% |
| Immigrants | Trinidad and Tobago | 0.0 /100 | #306 | Tragic 6.7% |
| Immigrants | Jamaica | 0.0 /100 | #307 | Tragic 6.7% |
| Aleuts | 0.0 /100 | #308 | Tragic 6.8% |
| Barbadians | 0.0 /100 | #309 | Tragic 6.9% |
| Blacks/African Americans | 0.0 /100 | #310 | Tragic 6.9% |
| Immigrants | Armenia | 0.0 /100 | #311 | Tragic 6.9% |
| Lumbee | 0.0 /100 | #312 | Tragic 6.9% |