Chickasaw vs African Male Unemployment
COMPARE
Chickasaw
African
Male Unemployment
Male Unemployment Comparison
Chickasaw
Africans
5.2%
MALE UNEMPLOYMENT
82.9/ 100
METRIC RATING
132nd/ 347
METRIC RANK
6.3%
MALE UNEMPLOYMENT
0.0/ 100
METRIC RATING
286th/ 347
METRIC RANK
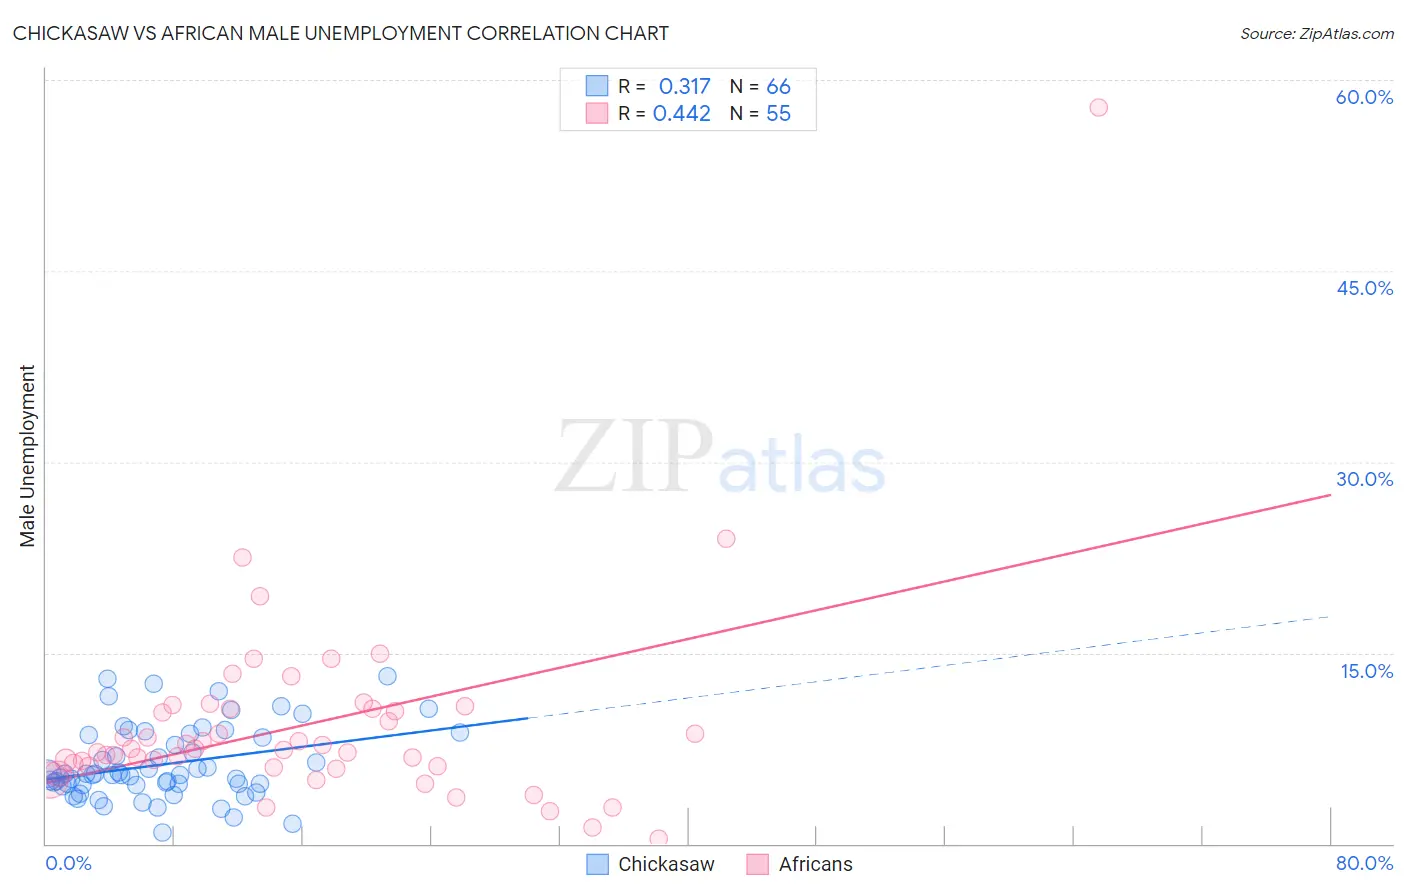
Chickasaw vs African Male Unemployment Correlation Chart
The statistical analysis conducted on geographies consisting of 147,341,260 people shows a mild positive correlation between the proportion of Chickasaw and unemployment rate among males in the United States with a correlation coefficient (R) of 0.317 and weighted average of 5.2%. Similarly, the statistical analysis conducted on geographies consisting of 467,193,011 people shows a moderate positive correlation between the proportion of Africans and unemployment rate among males in the United States with a correlation coefficient (R) of 0.442 and weighted average of 6.3%, a difference of 20.9%.
Male Unemployment Correlation Summary
| Measurement | Chickasaw | African |
| Minimum | 0.90% | 0.40% |
| Maximum | 13.2% | 57.8% |
| Range | 12.3% | 57.4% |
| Mean | 6.3% | 9.3% |
| Median | 5.4% | 7.5% |
| Interquartile 25% (IQ1) | 4.7% | 6.1% |
| Interquartile 75% (IQ3) | 8.5% | 10.6% |
| Interquartile Range (IQR) | 3.8% | 4.5% |
| Standard Deviation (Sample) | 2.8% | 8.1% |
| Standard Deviation (Population) | 2.8% | 8.0% |
Similar Demographics by Male Unemployment
Demographics Similar to Chickasaw by Male Unemployment
In terms of male unemployment, the demographic groups most similar to Chickasaw are Immigrants from Germany (5.2%, a difference of 0.020%), Immigrants from Malaysia (5.2%, a difference of 0.070%), Colombian (5.2%, a difference of 0.18%), Immigrants from Western Europe (5.2%, a difference of 0.21%), and Pakistani (5.2%, a difference of 0.24%).
| Demographics | Rating | Rank | Male Unemployment |
| Immigrants | Lithuania | 87.2 /100 | #125 | Excellent 5.1% |
| Immigrants | Colombia | 86.8 /100 | #126 | Excellent 5.1% |
| Immigrants | Brazil | 86.3 /100 | #127 | Excellent 5.2% |
| Hungarians | 85.1 /100 | #128 | Excellent 5.2% |
| Immigrants | Western Europe | 84.8 /100 | #129 | Excellent 5.2% |
| Immigrants | Malaysia | 83.5 /100 | #130 | Excellent 5.2% |
| Immigrants | Germany | 83.0 /100 | #131 | Excellent 5.2% |
| Chickasaw | 82.9 /100 | #132 | Excellent 5.2% |
| Colombians | 81.1 /100 | #133 | Excellent 5.2% |
| Pakistanis | 80.5 /100 | #134 | Excellent 5.2% |
| Immigrants | Saudi Arabia | 80.1 /100 | #135 | Excellent 5.2% |
| Lebanese | 79.9 /100 | #136 | Good 5.2% |
| Immigrants | Eastern Africa | 79.8 /100 | #137 | Good 5.2% |
| Immigrants | Croatia | 79.7 /100 | #138 | Good 5.2% |
| Kenyans | 79.4 /100 | #139 | Good 5.2% |
Demographics Similar to Africans by Male Unemployment
In terms of male unemployment, the demographic groups most similar to Africans are Central American Indian (6.3%, a difference of 0.29%), Immigrants from Senegal (6.3%, a difference of 0.33%), Immigrants from Ecuador (6.2%, a difference of 0.43%), Spanish American Indian (6.2%, a difference of 0.45%), and Immigrants from Caribbean (6.3%, a difference of 0.45%).
| Demographics | Rating | Rank | Male Unemployment |
| Ghanaians | 0.0 /100 | #279 | Tragic 6.1% |
| Immigrants | Ghana | 0.0 /100 | #280 | Tragic 6.2% |
| Sierra Leoneans | 0.0 /100 | #281 | Tragic 6.2% |
| Ecuadorians | 0.0 /100 | #282 | Tragic 6.2% |
| Immigrants | Western Africa | 0.0 /100 | #283 | Tragic 6.2% |
| Spanish American Indians | 0.0 /100 | #284 | Tragic 6.2% |
| Immigrants | Ecuador | 0.0 /100 | #285 | Tragic 6.2% |
| Africans | 0.0 /100 | #286 | Tragic 6.3% |
| Central American Indians | 0.0 /100 | #287 | Tragic 6.3% |
| Immigrants | Senegal | 0.0 /100 | #288 | Tragic 6.3% |
| Immigrants | Caribbean | 0.0 /100 | #289 | Tragic 6.3% |
| U.S. Virgin Islanders | 0.0 /100 | #290 | Tragic 6.4% |
| Immigrants | Azores | 0.0 /100 | #291 | Tragic 6.4% |
| Nepalese | 0.0 /100 | #292 | Tragic 6.4% |
| Haitians | 0.0 /100 | #293 | Tragic 6.4% |