Chickasaw vs Immigrants Male Unemployment
COMPARE
Chickasaw
Immigrants
Male Unemployment
Male Unemployment Comparison
Chickasaw
Immigrants
5.2%
MALE UNEMPLOYMENT
82.9/ 100
METRIC RATING
132nd/ 347
METRIC RANK
5.5%
MALE UNEMPLOYMENT
4.3/ 100
METRIC RATING
216th/ 347
METRIC RANK
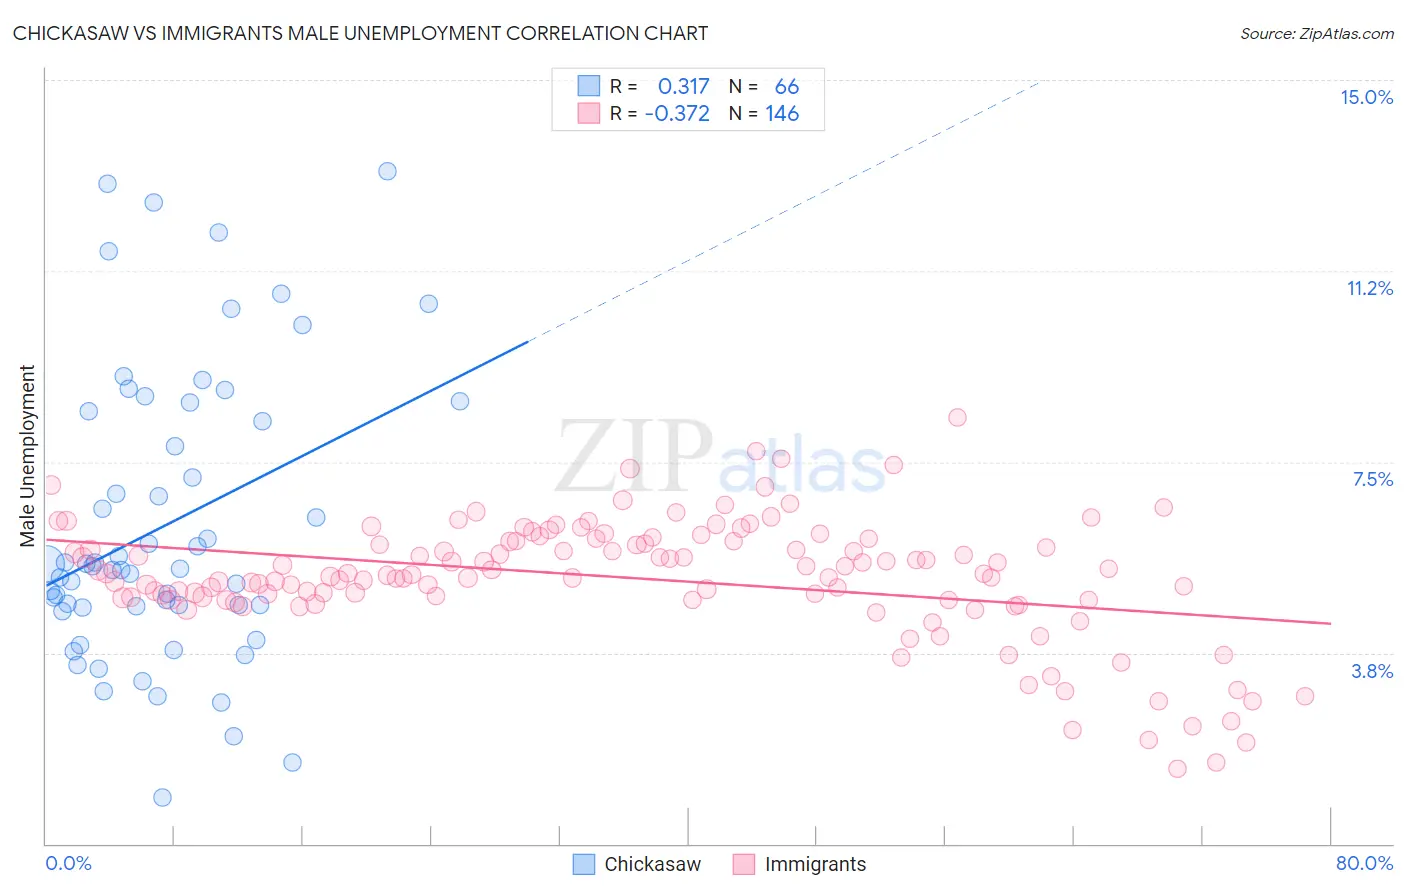
Chickasaw vs Immigrants Male Unemployment Correlation Chart
The statistical analysis conducted on geographies consisting of 147,341,260 people shows a mild positive correlation between the proportion of Chickasaw and unemployment rate among males in the United States with a correlation coefficient (R) of 0.317 and weighted average of 5.2%. Similarly, the statistical analysis conducted on geographies consisting of 566,323,513 people shows a mild negative correlation between the proportion of Immigrants and unemployment rate among males in the United States with a correlation coefficient (R) of -0.372 and weighted average of 5.5%, a difference of 7.0%.
Male Unemployment Correlation Summary
| Measurement | Chickasaw | Immigrants |
| Minimum | 0.90% | 1.5% |
| Maximum | 13.2% | 8.4% |
| Range | 12.3% | 6.9% |
| Mean | 6.3% | 5.2% |
| Median | 5.4% | 5.3% |
| Interquartile 25% (IQ1) | 4.7% | 4.8% |
| Interquartile 75% (IQ3) | 8.5% | 5.9% |
| Interquartile Range (IQR) | 3.8% | 1.1% |
| Standard Deviation (Sample) | 2.8% | 1.2% |
| Standard Deviation (Population) | 2.8% | 1.2% |
Similar Demographics by Male Unemployment
Demographics Similar to Chickasaw by Male Unemployment
In terms of male unemployment, the demographic groups most similar to Chickasaw are Immigrants from Germany (5.2%, a difference of 0.020%), Immigrants from Malaysia (5.2%, a difference of 0.070%), Colombian (5.2%, a difference of 0.18%), Immigrants from Western Europe (5.2%, a difference of 0.21%), and Pakistani (5.2%, a difference of 0.24%).
| Demographics | Rating | Rank | Male Unemployment |
| Immigrants | Lithuania | 87.2 /100 | #125 | Excellent 5.1% |
| Immigrants | Colombia | 86.8 /100 | #126 | Excellent 5.1% |
| Immigrants | Brazil | 86.3 /100 | #127 | Excellent 5.2% |
| Hungarians | 85.1 /100 | #128 | Excellent 5.2% |
| Immigrants | Western Europe | 84.8 /100 | #129 | Excellent 5.2% |
| Immigrants | Malaysia | 83.5 /100 | #130 | Excellent 5.2% |
| Immigrants | Germany | 83.0 /100 | #131 | Excellent 5.2% |
| Chickasaw | 82.9 /100 | #132 | Excellent 5.2% |
| Colombians | 81.1 /100 | #133 | Excellent 5.2% |
| Pakistanis | 80.5 /100 | #134 | Excellent 5.2% |
| Immigrants | Saudi Arabia | 80.1 /100 | #135 | Excellent 5.2% |
| Lebanese | 79.9 /100 | #136 | Good 5.2% |
| Immigrants | Eastern Africa | 79.8 /100 | #137 | Good 5.2% |
| Immigrants | Croatia | 79.7 /100 | #138 | Good 5.2% |
| Kenyans | 79.4 /100 | #139 | Good 5.2% |
Demographics Similar to Immigrants by Male Unemployment
In terms of male unemployment, the demographic groups most similar to Immigrants are Delaware (5.5%, a difference of 0.050%), Samoan (5.5%, a difference of 0.17%), Immigrants from Albania (5.5%, a difference of 0.26%), Immigrants from Western Asia (5.6%, a difference of 0.31%), and Portuguese (5.6%, a difference of 0.33%).
| Demographics | Rating | Rank | Male Unemployment |
| Immigrants | Middle Africa | 8.3 /100 | #209 | Tragic 5.5% |
| South American Indians | 7.6 /100 | #210 | Tragic 5.5% |
| Israelis | 7.4 /100 | #211 | Tragic 5.5% |
| Hmong | 7.0 /100 | #212 | Tragic 5.5% |
| Ugandans | 6.3 /100 | #213 | Tragic 5.5% |
| Puget Sound Salish | 5.6 /100 | #214 | Tragic 5.5% |
| Samoans | 4.9 /100 | #215 | Tragic 5.5% |
| Immigrants | Immigrants | 4.3 /100 | #216 | Tragic 5.5% |
| Delaware | 4.2 /100 | #217 | Tragic 5.5% |
| Immigrants | Albania | 3.6 /100 | #218 | Tragic 5.5% |
| Immigrants | Western Asia | 3.5 /100 | #219 | Tragic 5.6% |
| Portuguese | 3.5 /100 | #220 | Tragic 5.6% |
| Soviet Union | 3.2 /100 | #221 | Tragic 5.6% |
| Immigrants | Micronesia | 2.9 /100 | #222 | Tragic 5.6% |
| Creek | 2.6 /100 | #223 | Tragic 5.6% |