Tsimshian vs Immigrants Male Unemployment
COMPARE
Tsimshian
Immigrants
Male Unemployment
Male Unemployment Comparison
Tsimshian
Immigrants
8.5%
MALE UNEMPLOYMENT
0.0/ 100
METRIC RATING
334th/ 347
METRIC RANK
5.5%
MALE UNEMPLOYMENT
4.3/ 100
METRIC RATING
216th/ 347
METRIC RANK
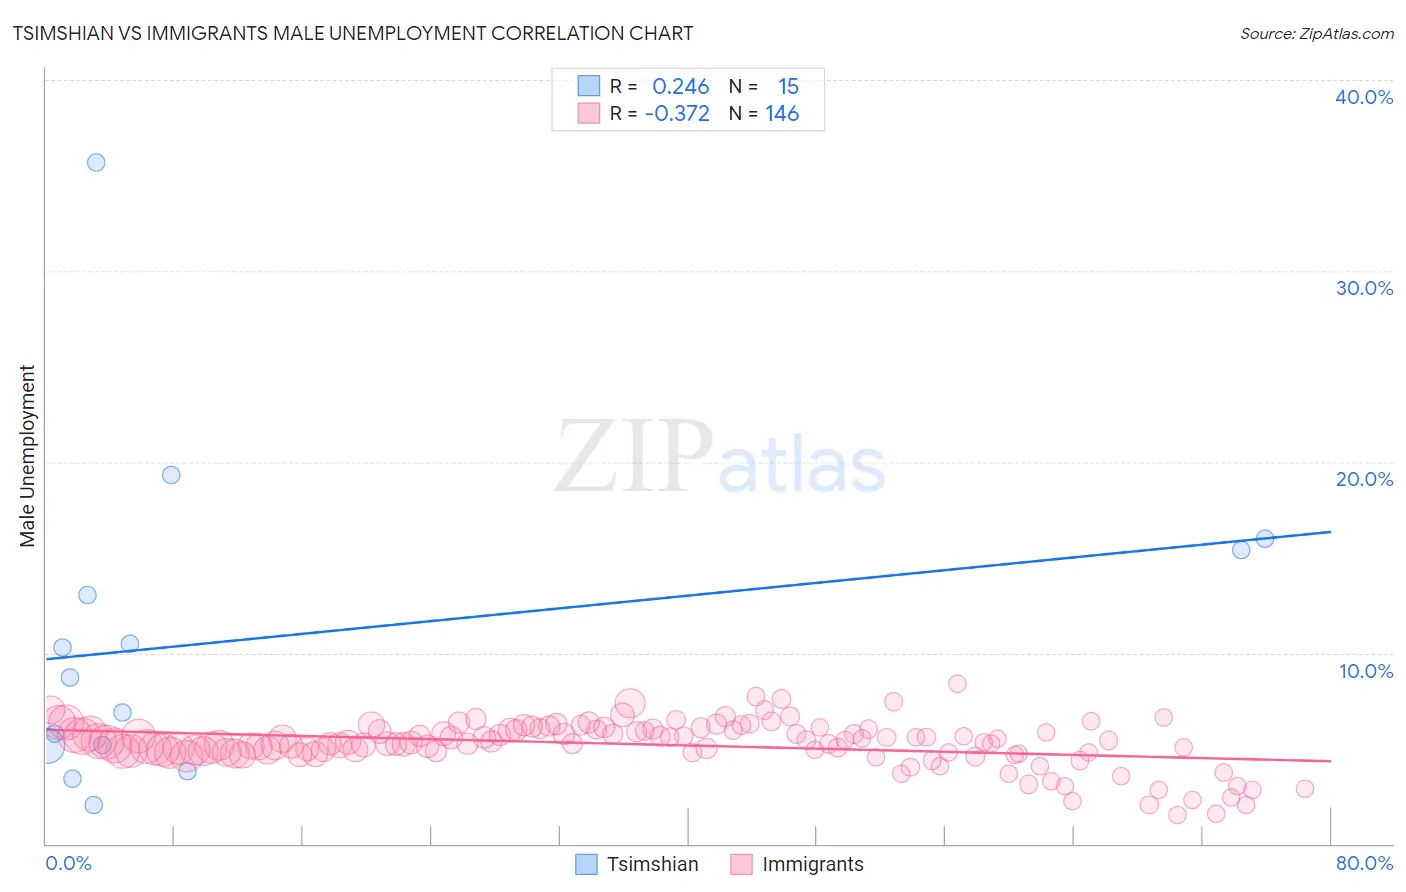
Tsimshian vs Immigrants Male Unemployment Correlation Chart
The statistical analysis conducted on geographies consisting of 15,613,259 people shows a weak positive correlation between the proportion of Tsimshian and unemployment rate among males in the United States with a correlation coefficient (R) of 0.246 and weighted average of 8.5%. Similarly, the statistical analysis conducted on geographies consisting of 566,323,513 people shows a mild negative correlation between the proportion of Immigrants and unemployment rate among males in the United States with a correlation coefficient (R) of -0.372 and weighted average of 5.5%, a difference of 52.9%.
Male Unemployment Correlation Summary
| Measurement | Tsimshian | Immigrants |
| Minimum | 2.0% | 1.5% |
| Maximum | 35.7% | 8.4% |
| Range | 33.7% | 6.9% |
| Mean | 10.7% | 5.2% |
| Median | 8.7% | 5.3% |
| Interquartile 25% (IQ1) | 5.1% | 4.8% |
| Interquartile 75% (IQ3) | 15.4% | 5.9% |
| Interquartile Range (IQR) | 10.3% | 1.1% |
| Standard Deviation (Sample) | 8.6% | 1.2% |
| Standard Deviation (Population) | 8.3% | 1.2% |
Similar Demographics by Male Unemployment
Demographics Similar to Tsimshian by Male Unemployment
In terms of male unemployment, the demographic groups most similar to Tsimshian are Pueblo (8.5%, a difference of 0.060%), Sioux (8.4%, a difference of 0.97%), Yuman (8.6%, a difference of 1.4%), Puerto Rican (8.6%, a difference of 1.5%), and Apache (8.6%, a difference of 1.7%).
| Demographics | Rating | Rank | Male Unemployment |
| Paiute | 0.0 /100 | #327 | Tragic 7.7% |
| Natives/Alaskans | 0.0 /100 | #328 | Tragic 7.7% |
| Immigrants | Yemen | 0.0 /100 | #329 | Tragic 7.8% |
| Yakama | 0.0 /100 | #330 | Tragic 7.9% |
| Alaska Natives | 0.0 /100 | #331 | Tragic 8.1% |
| Pima | 0.0 /100 | #332 | Tragic 8.3% |
| Sioux | 0.0 /100 | #333 | Tragic 8.4% |
| Tsimshian | 0.0 /100 | #334 | Tragic 8.5% |
| Pueblo | 0.0 /100 | #335 | Tragic 8.5% |
| Yuman | 0.0 /100 | #336 | Tragic 8.6% |
| Puerto Ricans | 0.0 /100 | #337 | Tragic 8.6% |
| Apache | 0.0 /100 | #338 | Tragic 8.6% |
| Cheyenne | 0.0 /100 | #339 | Tragic 9.8% |
| Alaskan Athabascans | 0.0 /100 | #340 | Tragic 9.8% |
| Navajo | 0.0 /100 | #341 | Tragic 9.8% |
Demographics Similar to Immigrants by Male Unemployment
In terms of male unemployment, the demographic groups most similar to Immigrants are Delaware (5.5%, a difference of 0.050%), Samoan (5.5%, a difference of 0.17%), Immigrants from Albania (5.5%, a difference of 0.26%), Immigrants from Western Asia (5.6%, a difference of 0.31%), and Portuguese (5.6%, a difference of 0.33%).
| Demographics | Rating | Rank | Male Unemployment |
| Immigrants | Middle Africa | 8.3 /100 | #209 | Tragic 5.5% |
| South American Indians | 7.6 /100 | #210 | Tragic 5.5% |
| Israelis | 7.4 /100 | #211 | Tragic 5.5% |
| Hmong | 7.0 /100 | #212 | Tragic 5.5% |
| Ugandans | 6.3 /100 | #213 | Tragic 5.5% |
| Puget Sound Salish | 5.6 /100 | #214 | Tragic 5.5% |
| Samoans | 4.9 /100 | #215 | Tragic 5.5% |
| Immigrants | Immigrants | 4.3 /100 | #216 | Tragic 5.5% |
| Delaware | 4.2 /100 | #217 | Tragic 5.5% |
| Immigrants | Albania | 3.6 /100 | #218 | Tragic 5.5% |
| Immigrants | Western Asia | 3.5 /100 | #219 | Tragic 5.6% |
| Portuguese | 3.5 /100 | #220 | Tragic 5.6% |
| Soviet Union | 3.2 /100 | #221 | Tragic 5.6% |
| Immigrants | Micronesia | 2.9 /100 | #222 | Tragic 5.6% |
| Creek | 2.6 /100 | #223 | Tragic 5.6% |