Chickasaw vs Immigrants 6th Grade
COMPARE
Chickasaw
Immigrants
6th Grade
6th Grade Comparison
Chickasaw
Immigrants
97.6%
6TH GRADE
99.5/ 100
METRIC RATING
71st/ 347
METRIC RANK
95.7%
6TH GRADE
0.0/ 100
METRIC RATING
301st/ 347
METRIC RANK
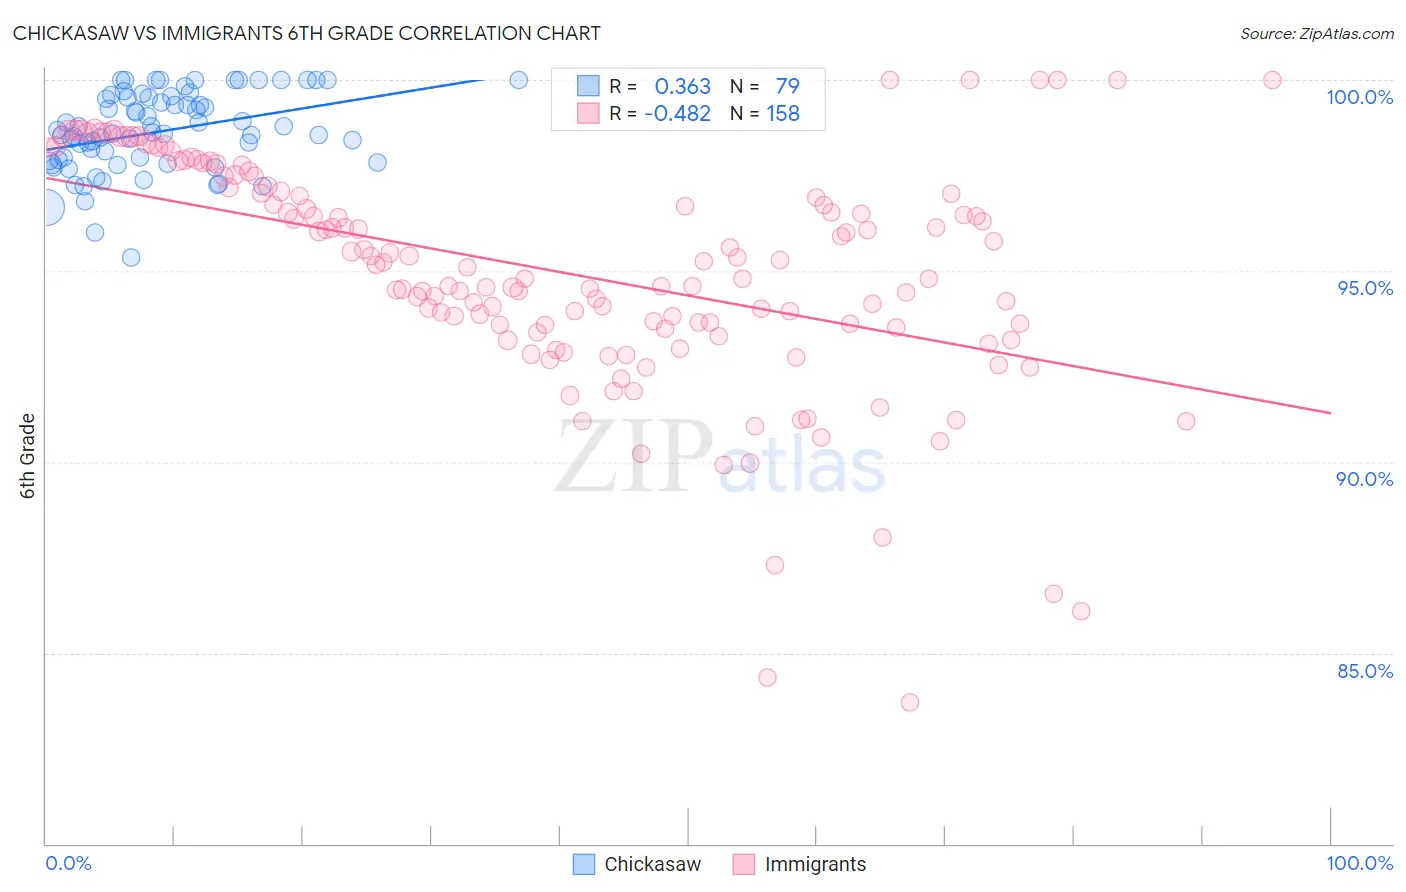
Chickasaw vs Immigrants 6th Grade Correlation Chart
The statistical analysis conducted on geographies consisting of 147,726,545 people shows a mild positive correlation between the proportion of Chickasaw and percentage of population with at least 6th grade education in the United States with a correlation coefficient (R) of 0.363 and weighted average of 97.6%. Similarly, the statistical analysis conducted on geographies consisting of 577,786,840 people shows a moderate negative correlation between the proportion of Immigrants and percentage of population with at least 6th grade education in the United States with a correlation coefficient (R) of -0.482 and weighted average of 95.7%, a difference of 2.0%.
6th Grade Correlation Summary
| Measurement | Chickasaw | Immigrants |
| Minimum | 95.4% | 83.7% |
| Maximum | 100.0% | 100.0% |
| Range | 4.6% | 16.3% |
| Mean | 98.7% | 95.0% |
| Median | 98.6% | 95.1% |
| Interquartile 25% (IQ1) | 97.9% | 93.5% |
| Interquartile 75% (IQ3) | 99.6% | 97.2% |
| Interquartile Range (IQR) | 1.7% | 3.7% |
| Standard Deviation (Sample) | 1.0% | 3.0% |
| Standard Deviation (Population) | 1.0% | 3.0% |
Similar Demographics by 6th Grade
Demographics Similar to Chickasaw by 6th Grade
In terms of 6th grade, the demographic groups most similar to Chickasaw are Cajun (97.6%, a difference of 0.010%), Macedonian (97.6%, a difference of 0.010%), Cherokee (97.6%, a difference of 0.010%), Immigrants from Netherlands (97.6%, a difference of 0.010%), and Iranian (97.6%, a difference of 0.020%).
| Demographics | Rating | Rank | 6th Grade |
| Canadians | 99.7 /100 | #64 | Exceptional 97.7% |
| Immigrants | Northern Europe | 99.6 /100 | #65 | Exceptional 97.7% |
| New Zealanders | 99.6 /100 | #66 | Exceptional 97.7% |
| Kiowa | 99.6 /100 | #67 | Exceptional 97.7% |
| Immigrants | Austria | 99.6 /100 | #68 | Exceptional 97.7% |
| Iranians | 99.6 /100 | #69 | Exceptional 97.6% |
| Cajuns | 99.5 /100 | #70 | Exceptional 97.6% |
| Chickasaw | 99.5 /100 | #71 | Exceptional 97.6% |
| Macedonians | 99.4 /100 | #72 | Exceptional 97.6% |
| Cherokee | 99.4 /100 | #73 | Exceptional 97.6% |
| Immigrants | Netherlands | 99.4 /100 | #74 | Exceptional 97.6% |
| Ukrainians | 99.4 /100 | #75 | Exceptional 97.6% |
| Immigrants | England | 99.4 /100 | #76 | Exceptional 97.6% |
| Immigrants | Lithuania | 99.3 /100 | #77 | Exceptional 97.6% |
| Icelanders | 99.3 /100 | #78 | Exceptional 97.6% |
Demographics Similar to Immigrants by 6th Grade
In terms of 6th grade, the demographic groups most similar to Immigrants are Immigrants from Dominica (95.7%, a difference of 0.010%), Immigrants from Laos (95.7%, a difference of 0.020%), Immigrants from Burma/Myanmar (95.7%, a difference of 0.020%), Sri Lankan (95.8%, a difference of 0.030%), and Bangladeshi (95.7%, a difference of 0.080%).
| Demographics | Rating | Rank | 6th Grade |
| British West Indians | 0.0 /100 | #294 | Tragic 96.0% |
| Immigrants | Grenada | 0.0 /100 | #295 | Tragic 95.9% |
| Immigrants | South Eastern Asia | 0.0 /100 | #296 | Tragic 95.9% |
| Haitians | 0.0 /100 | #297 | Tragic 95.8% |
| Sri Lankans | 0.0 /100 | #298 | Tragic 95.8% |
| Immigrants | Laos | 0.0 /100 | #299 | Tragic 95.7% |
| Immigrants | Dominica | 0.0 /100 | #300 | Tragic 95.7% |
| Immigrants | Immigrants | 0.0 /100 | #301 | Tragic 95.7% |
| Immigrants | Burma/Myanmar | 0.0 /100 | #302 | Tragic 95.7% |
| Bangladeshis | 0.0 /100 | #303 | Tragic 95.7% |
| Indonesians | 0.0 /100 | #304 | Tragic 95.6% |
| Immigrants | Cuba | 0.0 /100 | #305 | Tragic 95.6% |
| Immigrants | Haiti | 0.0 /100 | #306 | Tragic 95.6% |
| Guyanese | 0.0 /100 | #307 | Tragic 95.6% |
| Immigrants | Caribbean | 0.0 /100 | #308 | Tragic 95.6% |