Chickasaw vs Immigrants Householder Income Under 25 years
COMPARE
Chickasaw
Immigrants
Householder Income Under 25 years
Householder Income Under 25 years Comparison
Chickasaw
Immigrants
$44,763
HOUSEHOLDER INCOME UNDER 25 YEARS
0.0/ 100
METRIC RATING
338th/ 347
METRIC RANK
$53,201
HOUSEHOLDER INCOME UNDER 25 YEARS
92.2/ 100
METRIC RATING
133rd/ 347
METRIC RANK
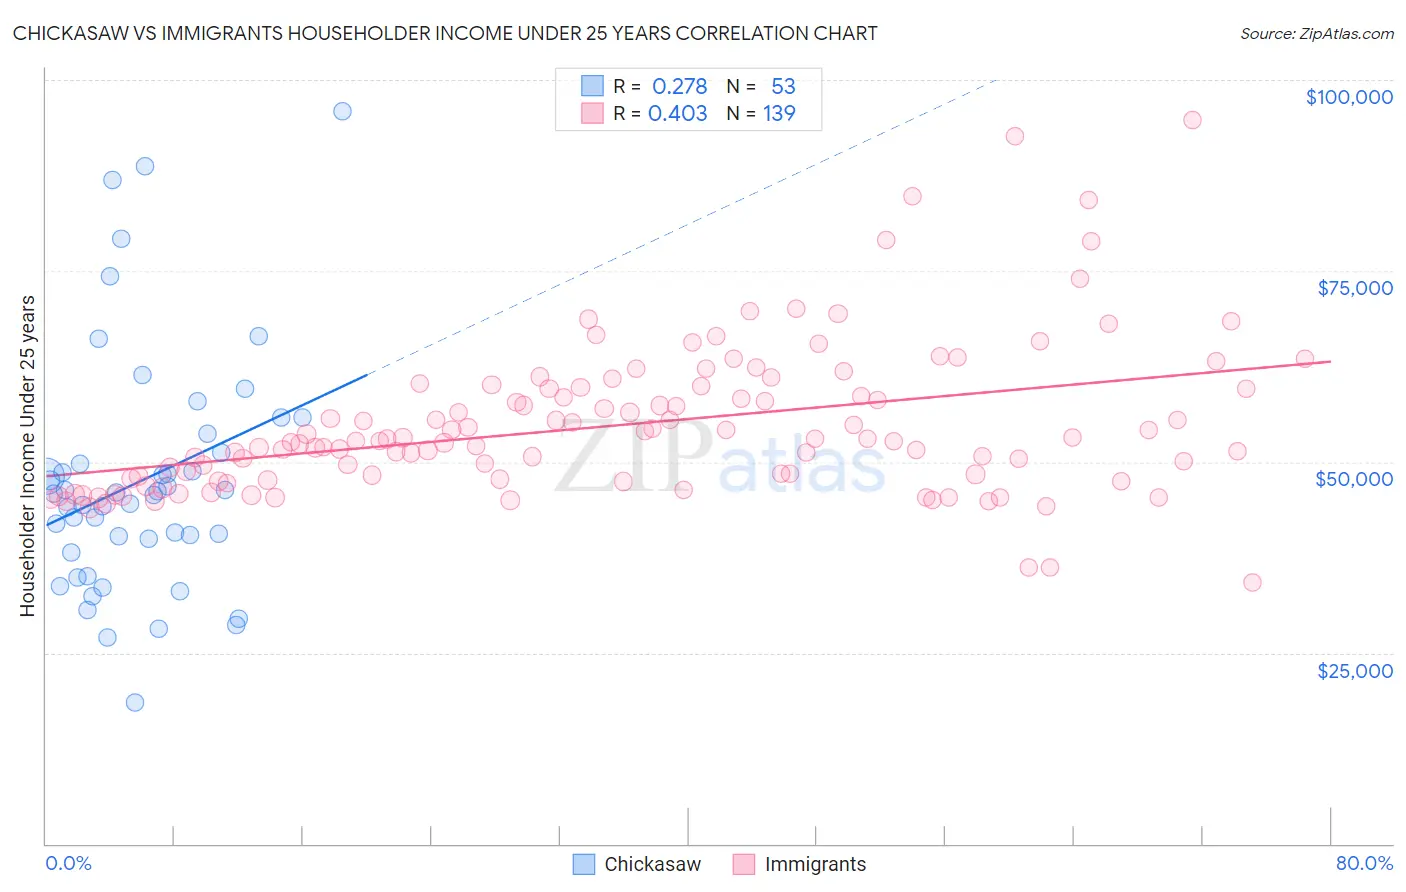
Chickasaw vs Immigrants Householder Income Under 25 years Correlation Chart
The statistical analysis conducted on geographies consisting of 137,295,377 people shows a weak positive correlation between the proportion of Chickasaw and household income with householder under the age of 25 in the United States with a correlation coefficient (R) of 0.278 and weighted average of $44,763. Similarly, the statistical analysis conducted on geographies consisting of 440,888,277 people shows a moderate positive correlation between the proportion of Immigrants and household income with householder under the age of 25 in the United States with a correlation coefficient (R) of 0.403 and weighted average of $53,201, a difference of 18.9%.
Householder Income Under 25 years Correlation Summary
| Measurement | Chickasaw | Immigrants |
| Minimum | $18,415 | $34,271 |
| Maximum | $95,833 | $94,688 |
| Range | $77,418 | $60,417 |
| Mean | $47,638 | $54,792 |
| Median | $45,852 | $52,736 |
| Interquartile 25% (IQ1) | $38,980 | $47,750 |
| Interquartile 75% (IQ3) | $52,456 | $59,631 |
| Interquartile Range (IQR) | $13,476 | $11,881 |
| Standard Deviation (Sample) | $15,738 | $9,932 |
| Standard Deviation (Population) | $15,588 | $9,896 |
Similar Demographics by Householder Income Under 25 years
Demographics Similar to Chickasaw by Householder Income Under 25 years
In terms of householder income under 25 years, the demographic groups most similar to Chickasaw are Kiowa ($44,733, a difference of 0.070%), Pueblo ($45,018, a difference of 0.57%), Black/African American ($44,381, a difference of 0.86%), Houma ($44,356, a difference of 0.92%), and Tohono O'odham ($45,248, a difference of 1.1%).
| Demographics | Rating | Rank | Householder Income Under 25 years |
| Immigrants | Zaire | 0.0 /100 | #331 | Tragic $45,529 |
| Choctaw | 0.0 /100 | #332 | Tragic $45,450 |
| Creek | 0.0 /100 | #333 | Tragic $45,371 |
| Cajuns | 0.0 /100 | #334 | Tragic $45,338 |
| Cheyenne | 0.0 /100 | #335 | Tragic $45,275 |
| Tohono O'odham | 0.0 /100 | #336 | Tragic $45,248 |
| Pueblo | 0.0 /100 | #337 | Tragic $45,018 |
| Chickasaw | 0.0 /100 | #338 | Tragic $44,763 |
| Kiowa | 0.0 /100 | #339 | Tragic $44,733 |
| Blacks/African Americans | 0.0 /100 | #340 | Tragic $44,381 |
| Houma | 0.0 /100 | #341 | Tragic $44,356 |
| Arapaho | 0.0 /100 | #342 | Tragic $44,003 |
| Immigrants | Yemen | 0.0 /100 | #343 | Tragic $43,591 |
| Immigrants | Congo | 0.0 /100 | #344 | Tragic $43,266 |
| Navajo | 0.0 /100 | #345 | Tragic $42,380 |
Demographics Similar to Immigrants by Householder Income Under 25 years
In terms of householder income under 25 years, the demographic groups most similar to Immigrants are Immigrants from Northern Africa ($53,185, a difference of 0.030%), Chilean ($53,185, a difference of 0.030%), Armenian ($53,179, a difference of 0.040%), Immigrants from Barbados ($53,163, a difference of 0.070%), and Moroccan ($53,256, a difference of 0.10%).
| Demographics | Rating | Rank | Householder Income Under 25 years |
| Immigrants | Serbia | 94.1 /100 | #126 | Exceptional $53,321 |
| Immigrants | North America | 93.9 /100 | #127 | Exceptional $53,307 |
| Immigrants | Bulgaria | 93.9 /100 | #128 | Exceptional $53,305 |
| New Zealanders | 93.7 /100 | #129 | Exceptional $53,294 |
| Nicaraguans | 93.4 /100 | #130 | Exceptional $53,275 |
| Immigrants | Nicaragua | 93.3 /100 | #131 | Exceptional $53,266 |
| Moroccans | 93.1 /100 | #132 | Exceptional $53,256 |
| Immigrants | Immigrants | 92.2 /100 | #133 | Exceptional $53,201 |
| Immigrants | Northern Africa | 91.9 /100 | #134 | Exceptional $53,185 |
| Chileans | 91.9 /100 | #135 | Exceptional $53,185 |
| Armenians | 91.8 /100 | #136 | Exceptional $53,179 |
| Immigrants | Barbados | 91.5 /100 | #137 | Exceptional $53,163 |
| Norwegians | 90.8 /100 | #138 | Exceptional $53,127 |
| Costa Ricans | 90.4 /100 | #139 | Exceptional $53,106 |
| Hawaiians | 89.8 /100 | #140 | Excellent $53,078 |