Spaniard vs Immigrants Male Unemployment
COMPARE
Spaniard
Immigrants
Male Unemployment
Male Unemployment Comparison
Spaniards
Immigrants
5.3%
MALE UNEMPLOYMENT
35.1/ 100
METRIC RATING
184th/ 347
METRIC RANK
5.5%
MALE UNEMPLOYMENT
4.3/ 100
METRIC RATING
216th/ 347
METRIC RANK
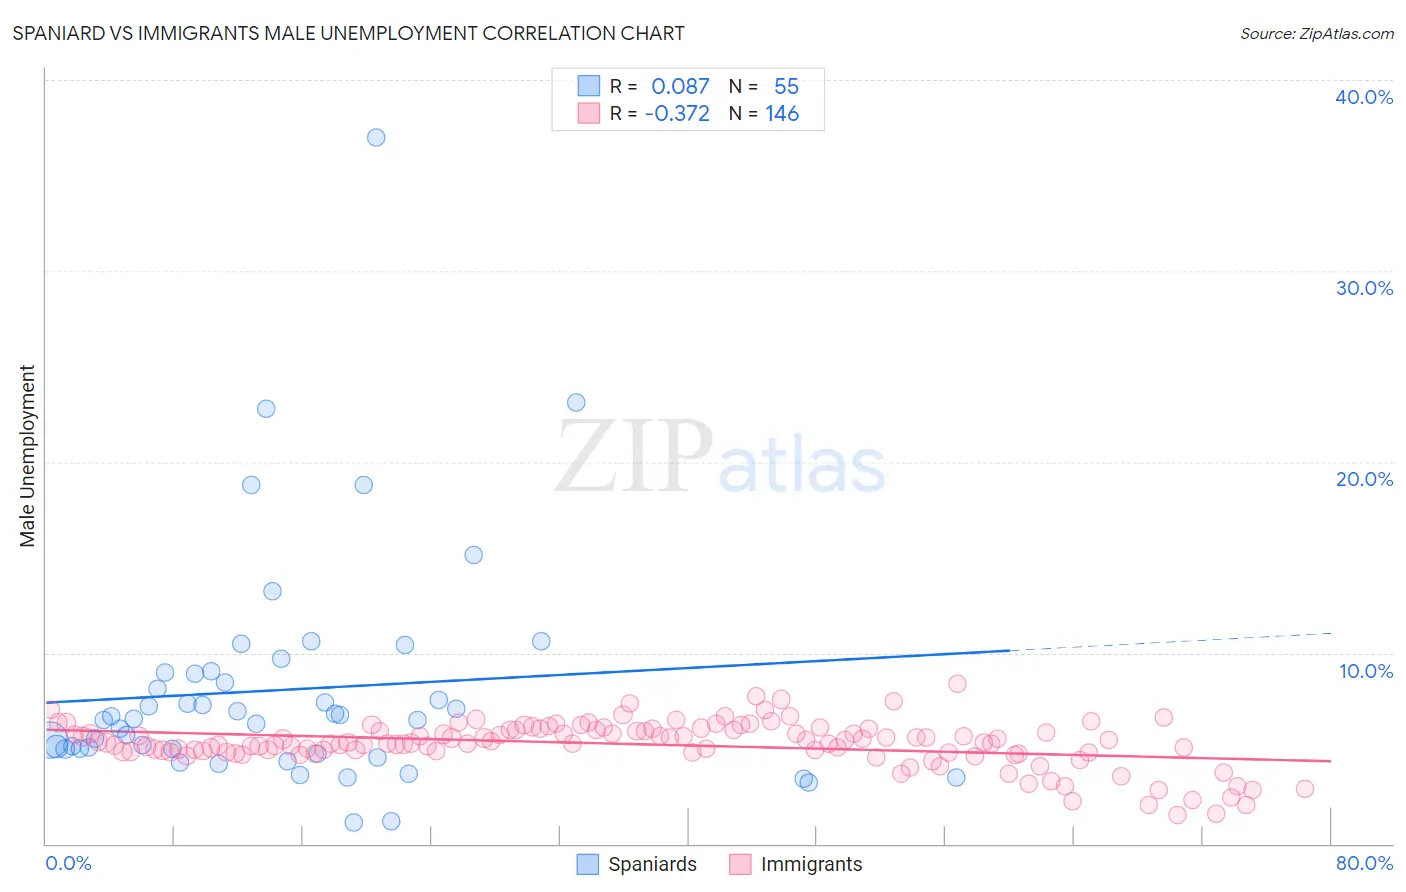
Spaniard vs Immigrants Male Unemployment Correlation Chart
The statistical analysis conducted on geographies consisting of 441,055,878 people shows a slight positive correlation between the proportion of Spaniards and unemployment rate among males in the United States with a correlation coefficient (R) of 0.087 and weighted average of 5.3%. Similarly, the statistical analysis conducted on geographies consisting of 566,323,513 people shows a mild negative correlation between the proportion of Immigrants and unemployment rate among males in the United States with a correlation coefficient (R) of -0.372 and weighted average of 5.5%, a difference of 3.6%.
Male Unemployment Correlation Summary
| Measurement | Spaniard | Immigrants |
| Minimum | 1.1% | 1.5% |
| Maximum | 37.0% | 8.4% |
| Range | 35.9% | 6.9% |
| Mean | 8.1% | 5.2% |
| Median | 6.6% | 5.3% |
| Interquartile 25% (IQ1) | 5.0% | 4.8% |
| Interquartile 75% (IQ3) | 8.9% | 5.9% |
| Interquartile Range (IQR) | 4.0% | 1.1% |
| Standard Deviation (Sample) | 6.1% | 1.2% |
| Standard Deviation (Population) | 6.0% | 1.2% |
Similar Demographics by Male Unemployment
Demographics Similar to Spaniards by Male Unemployment
In terms of male unemployment, the demographic groups most similar to Spaniards are Korean (5.3%, a difference of 0.010%), Taiwanese (5.3%, a difference of 0.16%), Potawatomi (5.3%, a difference of 0.17%), Immigrants from Afghanistan (5.3%, a difference of 0.18%), and Iraqi (5.4%, a difference of 0.23%).
| Demographics | Rating | Rank | Male Unemployment |
| Immigrants | Peru | 44.6 /100 | #177 | Average 5.3% |
| Osage | 42.5 /100 | #178 | Average 5.3% |
| Immigrants | Oceania | 40.8 /100 | #179 | Average 5.3% |
| Malaysians | 39.6 /100 | #180 | Fair 5.3% |
| Immigrants | Afghanistan | 37.9 /100 | #181 | Fair 5.3% |
| Potawatomi | 37.8 /100 | #182 | Fair 5.3% |
| Taiwanese | 37.6 /100 | #183 | Fair 5.3% |
| Spaniards | 35.1 /100 | #184 | Fair 5.3% |
| Koreans | 34.9 /100 | #185 | Fair 5.3% |
| Iraqis | 31.6 /100 | #186 | Fair 5.4% |
| Costa Ricans | 31.3 /100 | #187 | Fair 5.4% |
| Arabs | 30.2 /100 | #188 | Fair 5.4% |
| Immigrants | South America | 29.4 /100 | #189 | Fair 5.4% |
| Immigrants | Uganda | 28.8 /100 | #190 | Fair 5.4% |
| Immigrants | South Eastern Asia | 28.2 /100 | #191 | Fair 5.4% |
Demographics Similar to Immigrants by Male Unemployment
In terms of male unemployment, the demographic groups most similar to Immigrants are Delaware (5.5%, a difference of 0.050%), Samoan (5.5%, a difference of 0.17%), Immigrants from Albania (5.5%, a difference of 0.26%), Immigrants from Western Asia (5.6%, a difference of 0.31%), and Portuguese (5.6%, a difference of 0.33%).
| Demographics | Rating | Rank | Male Unemployment |
| Immigrants | Middle Africa | 8.3 /100 | #209 | Tragic 5.5% |
| South American Indians | 7.6 /100 | #210 | Tragic 5.5% |
| Israelis | 7.4 /100 | #211 | Tragic 5.5% |
| Hmong | 7.0 /100 | #212 | Tragic 5.5% |
| Ugandans | 6.3 /100 | #213 | Tragic 5.5% |
| Puget Sound Salish | 5.6 /100 | #214 | Tragic 5.5% |
| Samoans | 4.9 /100 | #215 | Tragic 5.5% |
| Immigrants | Immigrants | 4.3 /100 | #216 | Tragic 5.5% |
| Delaware | 4.2 /100 | #217 | Tragic 5.5% |
| Immigrants | Albania | 3.6 /100 | #218 | Tragic 5.5% |
| Immigrants | Western Asia | 3.5 /100 | #219 | Tragic 5.6% |
| Portuguese | 3.5 /100 | #220 | Tragic 5.6% |
| Soviet Union | 3.2 /100 | #221 | Tragic 5.6% |
| Immigrants | Micronesia | 2.9 /100 | #222 | Tragic 5.6% |
| Creek | 2.6 /100 | #223 | Tragic 5.6% |