Cajun vs German Russian Male Unemployment
COMPARE
Cajun
German Russian
Male Unemployment
Male Unemployment Comparison
Cajuns
German Russians
5.8%
MALE UNEMPLOYMENT
0.1/ 100
METRIC RATING
259th/ 347
METRIC RANK
5.1%
MALE UNEMPLOYMENT
92.7/ 100
METRIC RATING
101st/ 347
METRIC RANK
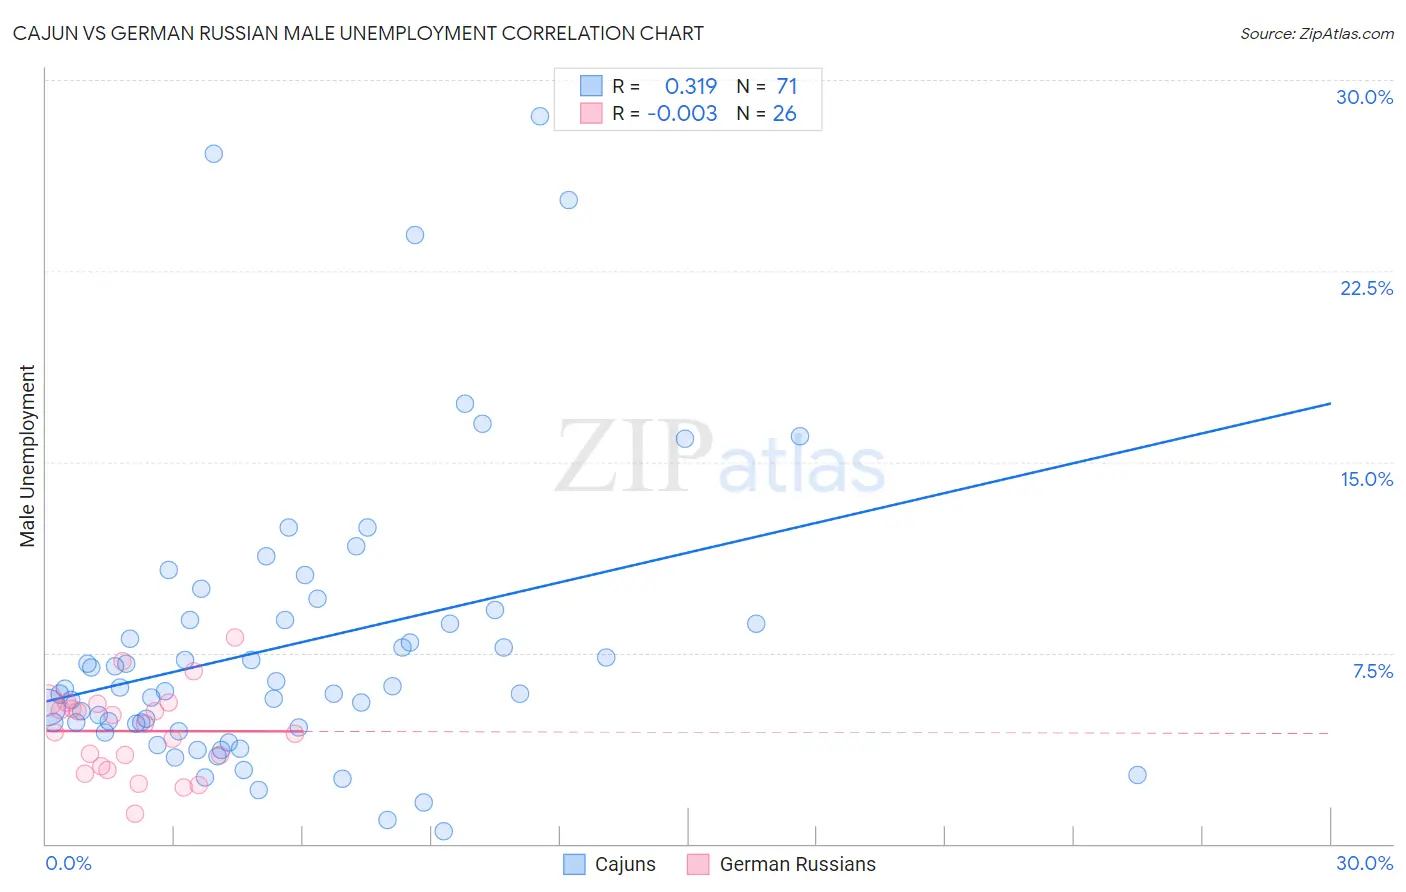
Cajun vs German Russian Male Unemployment Correlation Chart
The statistical analysis conducted on geographies consisting of 149,208,256 people shows a mild positive correlation between the proportion of Cajuns and unemployment rate among males in the United States with a correlation coefficient (R) of 0.319 and weighted average of 5.8%. Similarly, the statistical analysis conducted on geographies consisting of 96,273,571 people shows no correlation between the proportion of German Russians and unemployment rate among males in the United States with a correlation coefficient (R) of -0.003 and weighted average of 5.1%, a difference of 14.1%.
Male Unemployment Correlation Summary
| Measurement | Cajun | German Russian |
| Minimum | 0.50% | 1.2% |
| Maximum | 28.6% | 8.1% |
| Range | 28.1% | 6.9% |
| Mean | 7.8% | 4.4% |
| Median | 6.1% | 4.6% |
| Interquartile 25% (IQ1) | 4.6% | 3.0% |
| Interquartile 75% (IQ3) | 8.8% | 5.5% |
| Interquartile Range (IQR) | 4.2% | 2.5% |
| Standard Deviation (Sample) | 5.8% | 1.7% |
| Standard Deviation (Population) | 5.7% | 1.6% |
Similar Demographics by Male Unemployment
Demographics Similar to Cajuns by Male Unemployment
In terms of male unemployment, the demographic groups most similar to Cajuns are Immigrants from Central America (5.8%, a difference of 0.060%), Dutch West Indian (5.8%, a difference of 0.15%), Liberian (5.8%, a difference of 0.24%), Hispanic or Latino (5.8%, a difference of 0.29%), and Comanche (5.8%, a difference of 0.46%).
| Demographics | Rating | Rank | Male Unemployment |
| Mexicans | 0.2 /100 | #252 | Tragic 5.8% |
| Mexican American Indians | 0.2 /100 | #253 | Tragic 5.8% |
| Japanese | 0.2 /100 | #254 | Tragic 5.8% |
| Kiowa | 0.2 /100 | #255 | Tragic 5.8% |
| Comanche | 0.2 /100 | #256 | Tragic 5.8% |
| Hispanics or Latinos | 0.1 /100 | #257 | Tragic 5.8% |
| Dutch West Indians | 0.1 /100 | #258 | Tragic 5.8% |
| Cajuns | 0.1 /100 | #259 | Tragic 5.8% |
| Immigrants | Central America | 0.1 /100 | #260 | Tragic 5.8% |
| Liberians | 0.1 /100 | #261 | Tragic 5.8% |
| Immigrants | Portugal | 0.1 /100 | #262 | Tragic 5.9% |
| Immigrants | Latin America | 0.1 /100 | #263 | Tragic 5.9% |
| Immigrants | Mexico | 0.0 /100 | #264 | Tragic 5.9% |
| French American Indians | 0.0 /100 | #265 | Tragic 5.9% |
| Bahamians | 0.0 /100 | #266 | Tragic 5.9% |
Demographics Similar to German Russians by Male Unemployment
In terms of male unemployment, the demographic groups most similar to German Russians are Immigrants from France (5.1%, a difference of 0.020%), Russian (5.1%, a difference of 0.040%), Uruguayan (5.1%, a difference of 0.060%), Immigrants from Kuwait (5.1%, a difference of 0.12%), and Immigrants from Spain (5.1%, a difference of 0.16%).
| Demographics | Rating | Rank | Male Unemployment |
| Canadians | 94.1 /100 | #94 | Exceptional 5.1% |
| Italians | 93.8 /100 | #95 | Exceptional 5.1% |
| Asians | 93.7 /100 | #96 | Exceptional 5.1% |
| Immigrants | Spain | 93.4 /100 | #97 | Exceptional 5.1% |
| Immigrants | Kuwait | 93.3 /100 | #98 | Exceptional 5.1% |
| Uruguayans | 93.0 /100 | #99 | Exceptional 5.1% |
| Russians | 92.9 /100 | #100 | Exceptional 5.1% |
| German Russians | 92.7 /100 | #101 | Exceptional 5.1% |
| Immigrants | France | 92.7 /100 | #102 | Exceptional 5.1% |
| Immigrants | Jordan | 91.9 /100 | #103 | Exceptional 5.1% |
| Immigrants | Chile | 91.8 /100 | #104 | Exceptional 5.1% |
| Immigrants | Czechoslovakia | 91.7 /100 | #105 | Exceptional 5.1% |
| Immigrants | Ethiopia | 91.5 /100 | #106 | Exceptional 5.1% |
| Ethiopians | 91.3 /100 | #107 | Exceptional 5.1% |
| Immigrants | Nicaragua | 91.2 /100 | #108 | Exceptional 5.1% |