Burmese vs Immigrants from Venezuela Unemployment Among Women with Children Ages 6 to 17 years
COMPARE
Burmese
Immigrants from Venezuela
Unemployment Among Women with Children Ages 6 to 17 years
Unemployment Among Women with Children Ages 6 to 17 years Comparison
Burmese
Immigrants from Venezuela
8.0%
UNEMPLOYMENT AMONG WOMEN WITH CHILDREN AGES 6 TO 17 YEARS
100.0/ 100
METRIC RATING
36th/ 347
METRIC RANK
10.2%
UNEMPLOYMENT AMONG WOMEN WITH CHILDREN AGES 6 TO 17 YEARS
0.0/ 100
METRIC RATING
304th/ 347
METRIC RANK
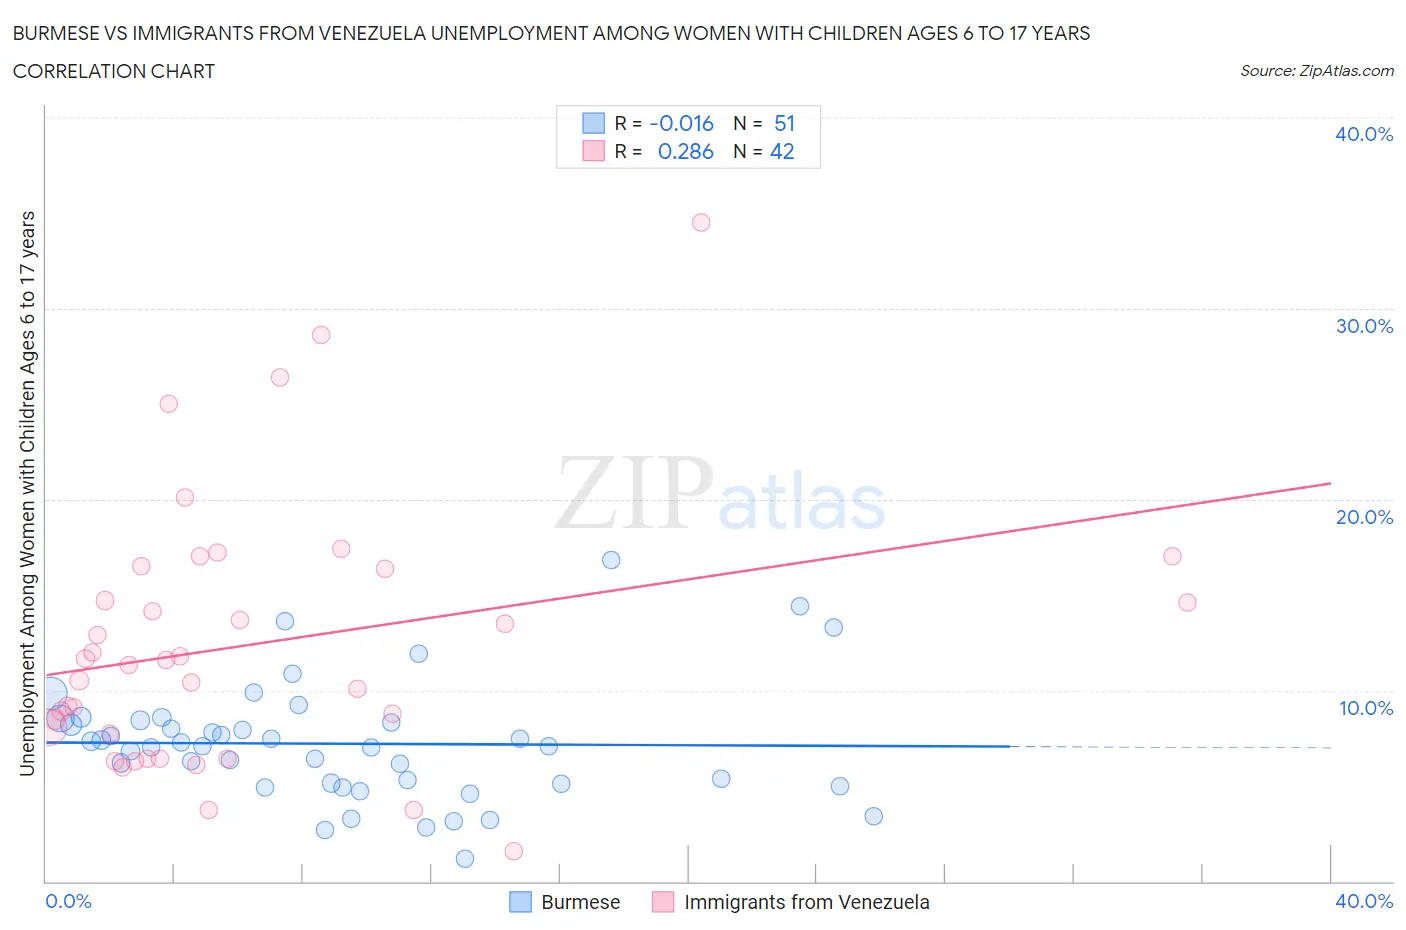
Burmese vs Immigrants from Venezuela Unemployment Among Women with Children Ages 6 to 17 years Correlation Chart
The statistical analysis conducted on geographies consisting of 320,179,112 people shows no correlation between the proportion of Burmese and unemployment rate among women with children between the ages 6 and 17 in the United States with a correlation coefficient (R) of -0.016 and weighted average of 8.0%. Similarly, the statistical analysis conducted on geographies consisting of 220,713,316 people shows a weak positive correlation between the proportion of Immigrants from Venezuela and unemployment rate among women with children between the ages 6 and 17 in the United States with a correlation coefficient (R) of 0.286 and weighted average of 10.2%, a difference of 28.1%.
Unemployment Among Women with Children Ages 6 to 17 years Correlation Summary
| Measurement | Burmese | Immigrants from Venezuela |
| Minimum | 1.2% | 1.6% |
| Maximum | 16.8% | 34.5% |
| Range | 15.6% | 32.9% |
| Mean | 7.2% | 12.4% |
| Median | 7.1% | 11.4% |
| Interquartile 25% (IQ1) | 5.1% | 7.7% |
| Interquartile 75% (IQ3) | 8.4% | 16.3% |
| Interquartile Range (IQR) | 3.3% | 8.6% |
| Standard Deviation (Sample) | 3.1% | 6.9% |
| Standard Deviation (Population) | 3.1% | 6.8% |
Similar Demographics by Unemployment Among Women with Children Ages 6 to 17 years
Demographics Similar to Burmese by Unemployment Among Women with Children Ages 6 to 17 years
In terms of unemployment among women with children ages 6 to 17 years, the demographic groups most similar to Burmese are Asian (8.0%, a difference of 0.030%), Immigrants from South Central Asia (7.9%, a difference of 0.080%), Native Hawaiian (7.9%, a difference of 0.18%), Alsatian (8.0%, a difference of 0.36%), and Immigrants from Korea (7.9%, a difference of 0.47%).
| Demographics | Rating | Rank | Unemployment Among Women with Children Ages 6 to 17 years |
| Thais | 100.0 /100 | #29 | Exceptional 7.8% |
| Immigrants | Iran | 100.0 /100 | #30 | Exceptional 7.9% |
| Laotians | 100.0 /100 | #31 | Exceptional 7.9% |
| Immigrants | Cambodia | 100.0 /100 | #32 | Exceptional 7.9% |
| Immigrants | Korea | 100.0 /100 | #33 | Exceptional 7.9% |
| Native Hawaiians | 100.0 /100 | #34 | Exceptional 7.9% |
| Immigrants | South Central Asia | 100.0 /100 | #35 | Exceptional 7.9% |
| Burmese | 100.0 /100 | #36 | Exceptional 8.0% |
| Asians | 100.0 /100 | #37 | Exceptional 8.0% |
| Alsatians | 100.0 /100 | #38 | Exceptional 8.0% |
| Somalis | 100.0 /100 | #39 | Exceptional 8.0% |
| Immigrants | Zimbabwe | 100.0 /100 | #40 | Exceptional 8.0% |
| Iranians | 100.0 /100 | #41 | Exceptional 8.0% |
| Immigrants | Somalia | 100.0 /100 | #42 | Exceptional 8.0% |
| Bhutanese | 100.0 /100 | #43 | Exceptional 8.1% |
Demographics Similar to Immigrants from Venezuela by Unemployment Among Women with Children Ages 6 to 17 years
In terms of unemployment among women with children ages 6 to 17 years, the demographic groups most similar to Immigrants from Venezuela are Immigrants from Nigeria (10.2%, a difference of 0.060%), Immigrants from Ecuador (10.2%, a difference of 0.090%), Venezuelan (10.2%, a difference of 0.27%), Paraguayan (10.2%, a difference of 0.35%), and Immigrants from Senegal (10.2%, a difference of 0.57%).
| Demographics | Rating | Rank | Unemployment Among Women with Children Ages 6 to 17 years |
| Immigrants | Caribbean | 0.0 /100 | #297 | Tragic 10.1% |
| Immigrants | Haiti | 0.0 /100 | #298 | Tragic 10.1% |
| Immigrants | Honduras | 0.0 /100 | #299 | Tragic 10.1% |
| Nigerians | 0.0 /100 | #300 | Tragic 10.1% |
| Immigrants | Bahamas | 0.0 /100 | #301 | Tragic 10.1% |
| Venezuelans | 0.0 /100 | #302 | Tragic 10.2% |
| Immigrants | Ecuador | 0.0 /100 | #303 | Tragic 10.2% |
| Immigrants | Venezuela | 0.0 /100 | #304 | Tragic 10.2% |
| Immigrants | Nigeria | 0.0 /100 | #305 | Tragic 10.2% |
| Paraguayans | 0.0 /100 | #306 | Tragic 10.2% |
| Immigrants | Senegal | 0.0 /100 | #307 | Tragic 10.2% |
| Dutch West Indians | 0.0 /100 | #308 | Tragic 10.2% |
| French Canadians | 0.0 /100 | #309 | Tragic 10.3% |
| Alaska Natives | 0.0 /100 | #310 | Tragic 10.3% |
| Immigrants | Liberia | 0.0 /100 | #311 | Tragic 10.3% |