Burmese vs Immigrants from Chile Unemployment Among Women with Children Ages 6 to 17 years
COMPARE
Burmese
Immigrants from Chile
Unemployment Among Women with Children Ages 6 to 17 years
Unemployment Among Women with Children Ages 6 to 17 years Comparison
Burmese
Immigrants from Chile
8.0%
UNEMPLOYMENT AMONG WOMEN WITH CHILDREN AGES 6 TO 17 YEARS
100.0/ 100
METRIC RATING
36th/ 347
METRIC RANK
8.9%
UNEMPLOYMENT AMONG WOMEN WITH CHILDREN AGES 6 TO 17 YEARS
65.3/ 100
METRIC RATING
158th/ 347
METRIC RANK
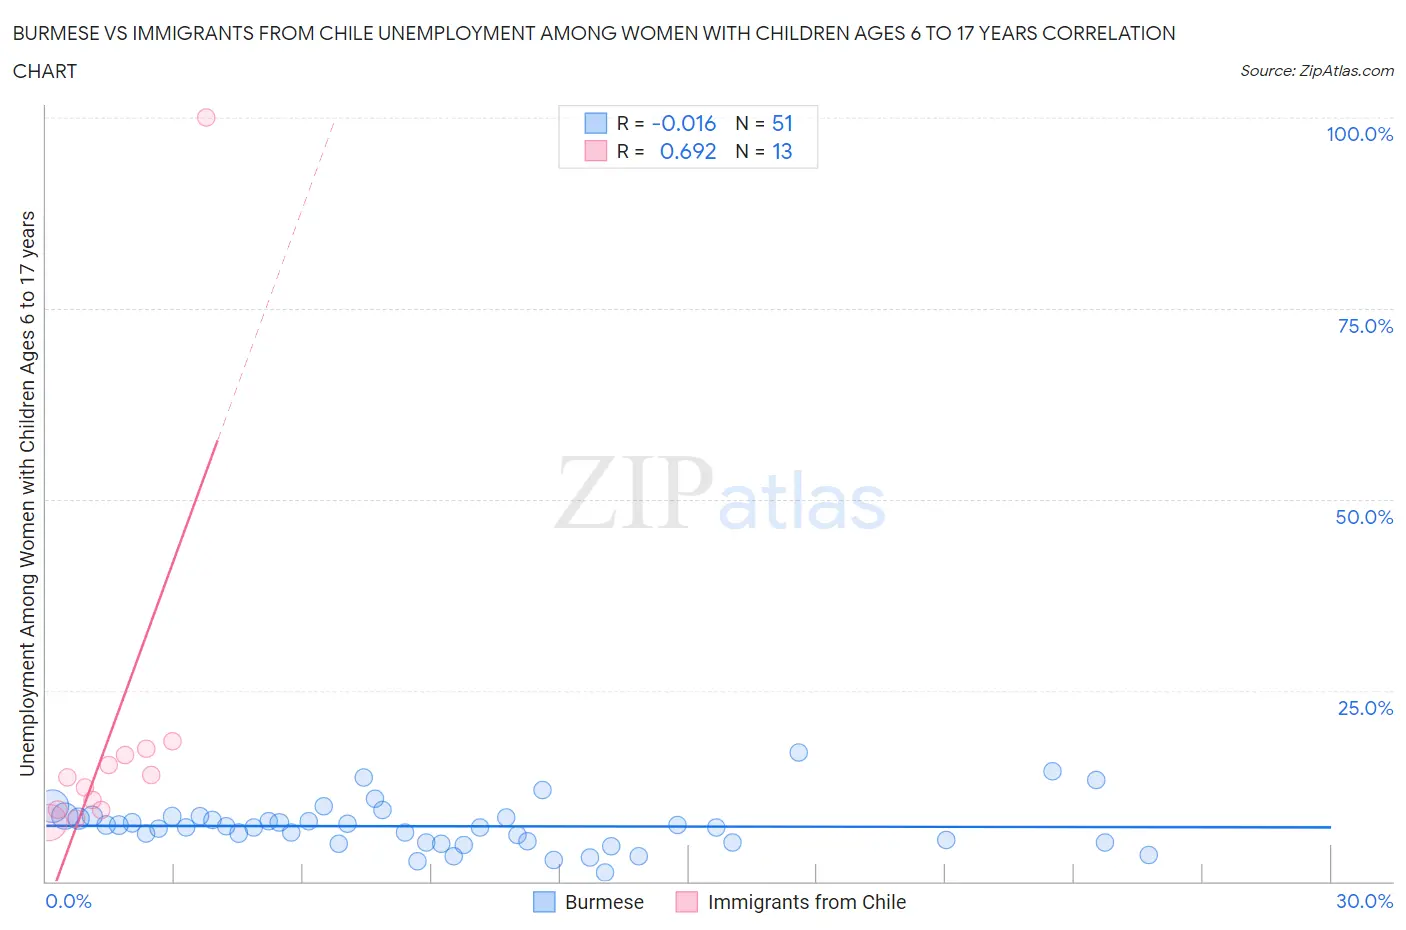
Burmese vs Immigrants from Chile Unemployment Among Women with Children Ages 6 to 17 years Correlation Chart
The statistical analysis conducted on geographies consisting of 320,179,112 people shows no correlation between the proportion of Burmese and unemployment rate among women with children between the ages 6 and 17 in the United States with a correlation coefficient (R) of -0.016 and weighted average of 8.0%. Similarly, the statistical analysis conducted on geographies consisting of 175,273,874 people shows a significant positive correlation between the proportion of Immigrants from Chile and unemployment rate among women with children between the ages 6 and 17 in the United States with a correlation coefficient (R) of 0.692 and weighted average of 8.9%, a difference of 11.9%.
Unemployment Among Women with Children Ages 6 to 17 years Correlation Summary
| Measurement | Burmese | Immigrants from Chile |
| Minimum | 1.2% | 7.8% |
| Maximum | 16.8% | 100.0% |
| Range | 15.6% | 92.2% |
| Mean | 7.2% | 19.4% |
| Median | 7.1% | 13.5% |
| Interquartile 25% (IQ1) | 5.1% | 9.3% |
| Interquartile 75% (IQ3) | 8.4% | 17.0% |
| Interquartile Range (IQR) | 3.3% | 7.7% |
| Standard Deviation (Sample) | 3.1% | 24.5% |
| Standard Deviation (Population) | 3.1% | 23.5% |
Similar Demographics by Unemployment Among Women with Children Ages 6 to 17 years
Demographics Similar to Burmese by Unemployment Among Women with Children Ages 6 to 17 years
In terms of unemployment among women with children ages 6 to 17 years, the demographic groups most similar to Burmese are Asian (8.0%, a difference of 0.030%), Immigrants from South Central Asia (7.9%, a difference of 0.080%), Native Hawaiian (7.9%, a difference of 0.18%), Alsatian (8.0%, a difference of 0.36%), and Immigrants from Korea (7.9%, a difference of 0.47%).
| Demographics | Rating | Rank | Unemployment Among Women with Children Ages 6 to 17 years |
| Thais | 100.0 /100 | #29 | Exceptional 7.8% |
| Immigrants | Iran | 100.0 /100 | #30 | Exceptional 7.9% |
| Laotians | 100.0 /100 | #31 | Exceptional 7.9% |
| Immigrants | Cambodia | 100.0 /100 | #32 | Exceptional 7.9% |
| Immigrants | Korea | 100.0 /100 | #33 | Exceptional 7.9% |
| Native Hawaiians | 100.0 /100 | #34 | Exceptional 7.9% |
| Immigrants | South Central Asia | 100.0 /100 | #35 | Exceptional 7.9% |
| Burmese | 100.0 /100 | #36 | Exceptional 8.0% |
| Asians | 100.0 /100 | #37 | Exceptional 8.0% |
| Alsatians | 100.0 /100 | #38 | Exceptional 8.0% |
| Somalis | 100.0 /100 | #39 | Exceptional 8.0% |
| Immigrants | Zimbabwe | 100.0 /100 | #40 | Exceptional 8.0% |
| Iranians | 100.0 /100 | #41 | Exceptional 8.0% |
| Immigrants | Somalia | 100.0 /100 | #42 | Exceptional 8.0% |
| Bhutanese | 100.0 /100 | #43 | Exceptional 8.1% |
Demographics Similar to Immigrants from Chile by Unemployment Among Women with Children Ages 6 to 17 years
In terms of unemployment among women with children ages 6 to 17 years, the demographic groups most similar to Immigrants from Chile are Immigrants from Belgium (8.9%, a difference of 0.010%), Osage (8.9%, a difference of 0.030%), Spanish (8.9%, a difference of 0.070%), Immigrants from Hungary (8.9%, a difference of 0.090%), and Immigrants from Guyana (8.9%, a difference of 0.12%).
| Demographics | Rating | Rank | Unemployment Among Women with Children Ages 6 to 17 years |
| Immigrants | Eastern Africa | 74.6 /100 | #151 | Good 8.9% |
| Immigrants | Northern Europe | 74.6 /100 | #152 | Good 8.9% |
| Immigrants | Europe | 73.4 /100 | #153 | Good 8.9% |
| Vietnamese | 72.1 /100 | #154 | Good 8.9% |
| Immigrants | Greece | 71.8 /100 | #155 | Good 8.9% |
| Osage | 65.9 /100 | #156 | Good 8.9% |
| Immigrants | Belgium | 65.6 /100 | #157 | Good 8.9% |
| Immigrants | Chile | 65.3 /100 | #158 | Good 8.9% |
| Spanish | 63.8 /100 | #159 | Good 8.9% |
| Immigrants | Hungary | 63.4 /100 | #160 | Good 8.9% |
| Immigrants | Guyana | 63.0 /100 | #161 | Good 8.9% |
| Immigrants | Netherlands | 60.8 /100 | #162 | Good 8.9% |
| Mexican American Indians | 60.6 /100 | #163 | Good 8.9% |
| Ukrainians | 59.7 /100 | #164 | Average 8.9% |
| Immigrants | Micronesia | 59.2 /100 | #165 | Average 8.9% |