Burmese vs Cherokee Unemployment
COMPARE
Burmese
Cherokee
Unemployment
Unemployment Comparison
Burmese
Cherokee
4.9%
UNEMPLOYMENT
98.3/ 100
METRIC RATING
72nd/ 347
METRIC RANK
5.3%
UNEMPLOYMENT
25.5/ 100
METRIC RATING
202nd/ 347
METRIC RANK
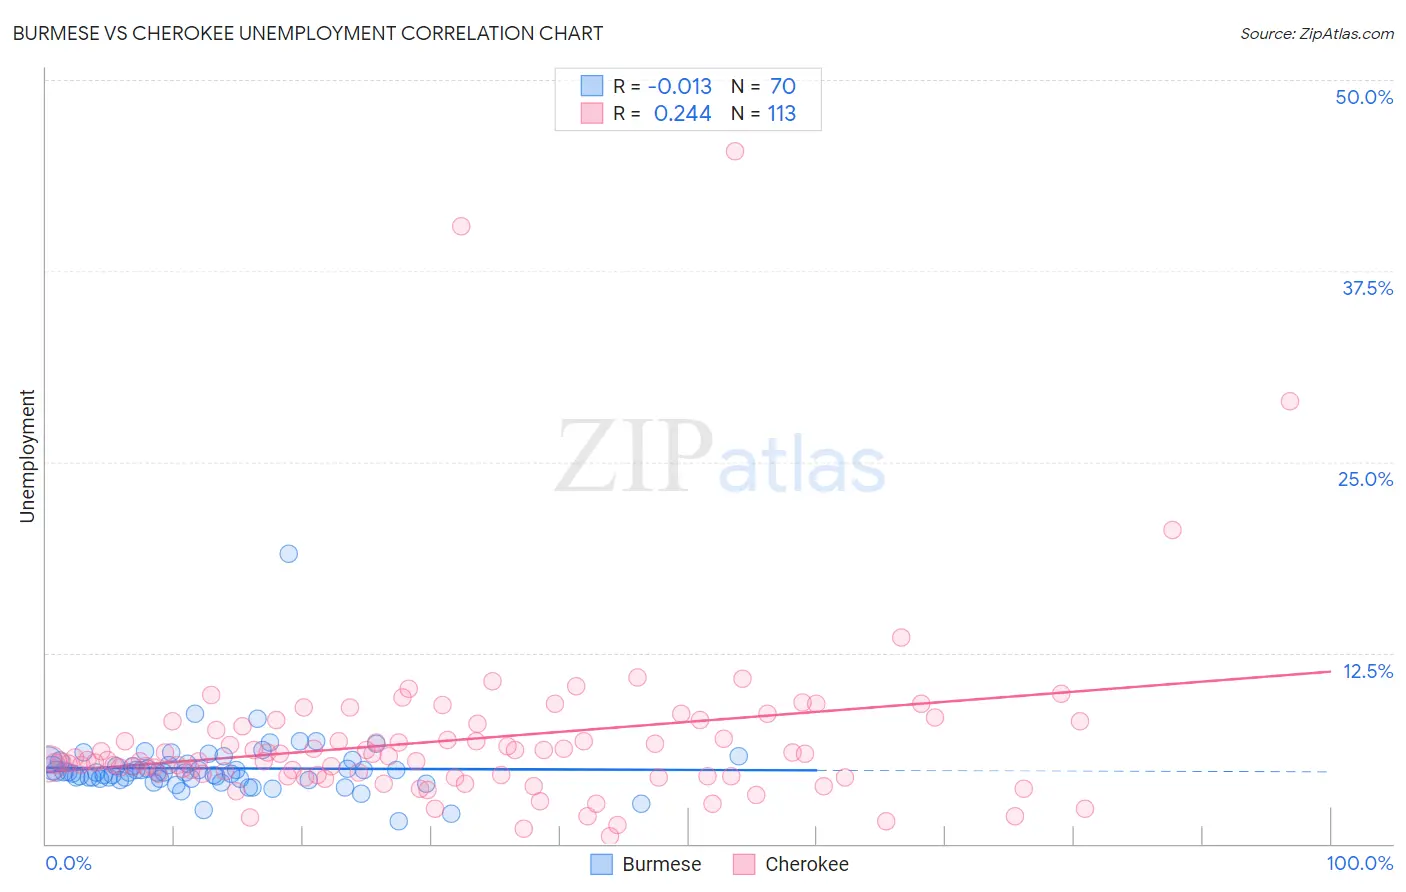
Burmese vs Cherokee Unemployment Correlation Chart
The statistical analysis conducted on geographies consisting of 464,710,374 people shows no correlation between the proportion of Burmese and unemployment in the United States with a correlation coefficient (R) of -0.013 and weighted average of 4.9%. Similarly, the statistical analysis conducted on geographies consisting of 492,075,585 people shows a weak positive correlation between the proportion of Cherokee and unemployment in the United States with a correlation coefficient (R) of 0.244 and weighted average of 5.3%, a difference of 8.4%.
Unemployment Correlation Summary
| Measurement | Burmese | Cherokee |
| Minimum | 1.5% | 0.50% |
| Maximum | 19.0% | 45.3% |
| Range | 17.5% | 44.8% |
| Mean | 4.9% | 6.8% |
| Median | 4.7% | 5.5% |
| Interquartile 25% (IQ1) | 4.3% | 4.4% |
| Interquartile 75% (IQ3) | 5.3% | 7.8% |
| Interquartile Range (IQR) | 0.98% | 3.3% |
| Standard Deviation (Sample) | 2.1% | 6.0% |
| Standard Deviation (Population) | 2.1% | 6.0% |
Similar Demographics by Unemployment
Demographics Similar to Burmese by Unemployment
In terms of unemployment, the demographic groups most similar to Burmese are Immigrants from Japan (4.9%, a difference of 0.020%), Paraguayan (4.9%, a difference of 0.040%), Serbian (4.9%, a difference of 0.080%), Immigrants from Northern Europe (4.9%, a difference of 0.14%), and Immigrants from North America (4.9%, a difference of 0.23%).
| Demographics | Rating | Rank | Unemployment |
| Immigrants | Canada | 98.8 /100 | #65 | Exceptional 4.9% |
| Slovaks | 98.7 /100 | #66 | Exceptional 4.9% |
| New Zealanders | 98.6 /100 | #67 | Exceptional 4.9% |
| Slavs | 98.6 /100 | #68 | Exceptional 4.9% |
| Immigrants | North America | 98.5 /100 | #69 | Exceptional 4.9% |
| Serbians | 98.4 /100 | #70 | Exceptional 4.9% |
| Immigrants | Japan | 98.3 /100 | #71 | Exceptional 4.9% |
| Burmese | 98.3 /100 | #72 | Exceptional 4.9% |
| Paraguayans | 98.3 /100 | #73 | Exceptional 4.9% |
| Immigrants | Northern Europe | 98.2 /100 | #74 | Exceptional 4.9% |
| Turks | 98.0 /100 | #75 | Exceptional 4.9% |
| German Russians | 98.0 /100 | #76 | Exceptional 4.9% |
| Cypriots | 97.9 /100 | #77 | Exceptional 4.9% |
| Okinawans | 97.9 /100 | #78 | Exceptional 4.9% |
| Canadians | 97.7 /100 | #79 | Exceptional 5.0% |
Demographics Similar to Cherokee by Unemployment
In terms of unemployment, the demographic groups most similar to Cherokee are Immigrants from Micronesia (5.3%, a difference of 0.030%), Immigrants from Ukraine (5.3%, a difference of 0.050%), Native Hawaiian (5.3%, a difference of 0.11%), Immigrants from South Eastern Asia (5.3%, a difference of 0.12%), and Korean (5.3%, a difference of 0.14%).
| Demographics | Rating | Rank | Unemployment |
| Immigrants | Southern Europe | 30.9 /100 | #195 | Fair 5.3% |
| Peruvians | 29.9 /100 | #196 | Fair 5.3% |
| Immigrants | Uruguay | 29.8 /100 | #197 | Fair 5.3% |
| Immigrants | Israel | 28.6 /100 | #198 | Fair 5.3% |
| Immigrants | Afghanistan | 28.6 /100 | #199 | Fair 5.3% |
| Koreans | 27.4 /100 | #200 | Fair 5.3% |
| Immigrants | South Eastern Asia | 27.0 /100 | #201 | Fair 5.3% |
| Cherokee | 25.5 /100 | #202 | Fair 5.3% |
| Immigrants | Micronesia | 25.2 /100 | #203 | Fair 5.3% |
| Immigrants | Ukraine | 24.9 /100 | #204 | Fair 5.3% |
| Native Hawaiians | 24.1 /100 | #205 | Fair 5.3% |
| Immigrants | Peru | 22.7 /100 | #206 | Fair 5.4% |
| Creek | 19.4 /100 | #207 | Poor 5.4% |
| Portuguese | 19.0 /100 | #208 | Poor 5.4% |
| Immigrants | Iran | 18.8 /100 | #209 | Poor 5.4% |