Burmese vs Afghan Unemployment
COMPARE
Burmese
Afghan
Unemployment
Unemployment Comparison
Burmese
Afghans
4.9%
UNEMPLOYMENT
98.3/ 100
METRIC RATING
72nd/ 347
METRIC RANK
5.3%
UNEMPLOYMENT
47.4/ 100
METRIC RATING
178th/ 347
METRIC RANK
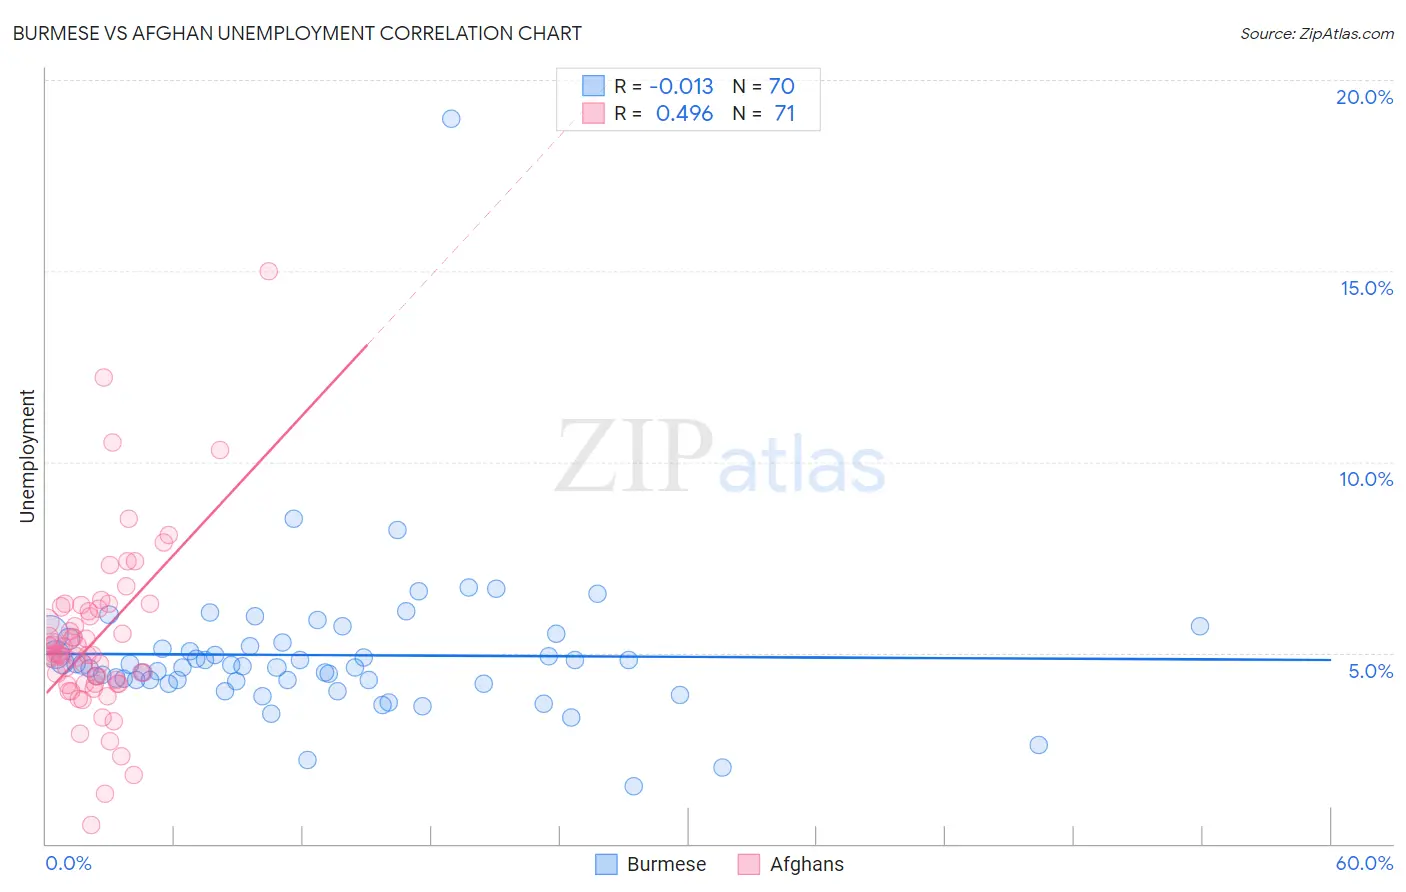
Burmese vs Afghan Unemployment Correlation Chart
The statistical analysis conducted on geographies consisting of 464,710,374 people shows no correlation between the proportion of Burmese and unemployment in the United States with a correlation coefficient (R) of -0.013 and weighted average of 4.9%. Similarly, the statistical analysis conducted on geographies consisting of 148,850,223 people shows a moderate positive correlation between the proportion of Afghans and unemployment in the United States with a correlation coefficient (R) of 0.496 and weighted average of 5.3%, a difference of 6.8%.
Unemployment Correlation Summary
| Measurement | Burmese | Afghan |
| Minimum | 1.5% | 0.50% |
| Maximum | 19.0% | 15.0% |
| Range | 17.5% | 14.5% |
| Mean | 4.9% | 5.3% |
| Median | 4.7% | 5.0% |
| Interquartile 25% (IQ1) | 4.3% | 4.2% |
| Interquartile 75% (IQ3) | 5.3% | 6.2% |
| Interquartile Range (IQR) | 0.98% | 2.0% |
| Standard Deviation (Sample) | 2.1% | 2.2% |
| Standard Deviation (Population) | 2.1% | 2.2% |
Similar Demographics by Unemployment
Demographics Similar to Burmese by Unemployment
In terms of unemployment, the demographic groups most similar to Burmese are Immigrants from Japan (4.9%, a difference of 0.020%), Paraguayan (4.9%, a difference of 0.040%), Serbian (4.9%, a difference of 0.080%), Immigrants from Northern Europe (4.9%, a difference of 0.14%), and Immigrants from North America (4.9%, a difference of 0.23%).
| Demographics | Rating | Rank | Unemployment |
| Immigrants | Canada | 98.8 /100 | #65 | Exceptional 4.9% |
| Slovaks | 98.7 /100 | #66 | Exceptional 4.9% |
| New Zealanders | 98.6 /100 | #67 | Exceptional 4.9% |
| Slavs | 98.6 /100 | #68 | Exceptional 4.9% |
| Immigrants | North America | 98.5 /100 | #69 | Exceptional 4.9% |
| Serbians | 98.4 /100 | #70 | Exceptional 4.9% |
| Immigrants | Japan | 98.3 /100 | #71 | Exceptional 4.9% |
| Burmese | 98.3 /100 | #72 | Exceptional 4.9% |
| Paraguayans | 98.3 /100 | #73 | Exceptional 4.9% |
| Immigrants | Northern Europe | 98.2 /100 | #74 | Exceptional 4.9% |
| Turks | 98.0 /100 | #75 | Exceptional 4.9% |
| German Russians | 98.0 /100 | #76 | Exceptional 4.9% |
| Cypriots | 97.9 /100 | #77 | Exceptional 4.9% |
| Okinawans | 97.9 /100 | #78 | Exceptional 4.9% |
| Canadians | 97.7 /100 | #79 | Exceptional 5.0% |
Demographics Similar to Afghans by Unemployment
In terms of unemployment, the demographic groups most similar to Afghans are Nonimmigrants (5.3%, a difference of 0.030%), Malaysian (5.3%, a difference of 0.030%), Nicaraguan (5.3%, a difference of 0.080%), Taiwanese (5.3%, a difference of 0.14%), and Immigrants from Greece (5.3%, a difference of 0.15%).
| Demographics | Rating | Rank | Unemployment |
| Puget Sound Salish | 56.6 /100 | #171 | Average 5.2% |
| Immigrants | Vietnam | 52.5 /100 | #172 | Average 5.2% |
| Immigrants | Poland | 51.8 /100 | #173 | Average 5.3% |
| Immigrants | Congo | 50.0 /100 | #174 | Average 5.3% |
| Taiwanese | 49.6 /100 | #175 | Average 5.3% |
| Nicaraguans | 48.7 /100 | #176 | Average 5.3% |
| Immigrants | Nonimmigrants | 47.9 /100 | #177 | Average 5.3% |
| Afghans | 47.4 /100 | #178 | Average 5.3% |
| Malaysians | 46.8 /100 | #179 | Average 5.3% |
| Immigrants | Greece | 45.0 /100 | #180 | Average 5.3% |
| Albanians | 43.5 /100 | #181 | Average 5.3% |
| Spaniards | 42.2 /100 | #182 | Average 5.3% |
| Brazilians | 40.2 /100 | #183 | Average 5.3% |
| Assyrians/Chaldeans/Syriacs | 39.2 /100 | #184 | Fair 5.3% |
| Immigrants | Thailand | 38.9 /100 | #185 | Fair 5.3% |