Burmese vs Pennsylvania German Unemployment
COMPARE
Burmese
Pennsylvania German
Unemployment
Unemployment Comparison
Burmese
Pennsylvania Germans
4.9%
UNEMPLOYMENT
98.3/ 100
METRIC RATING
72nd/ 347
METRIC RANK
4.6%
UNEMPLOYMENT
100.0/ 100
METRIC RATING
12th/ 347
METRIC RANK
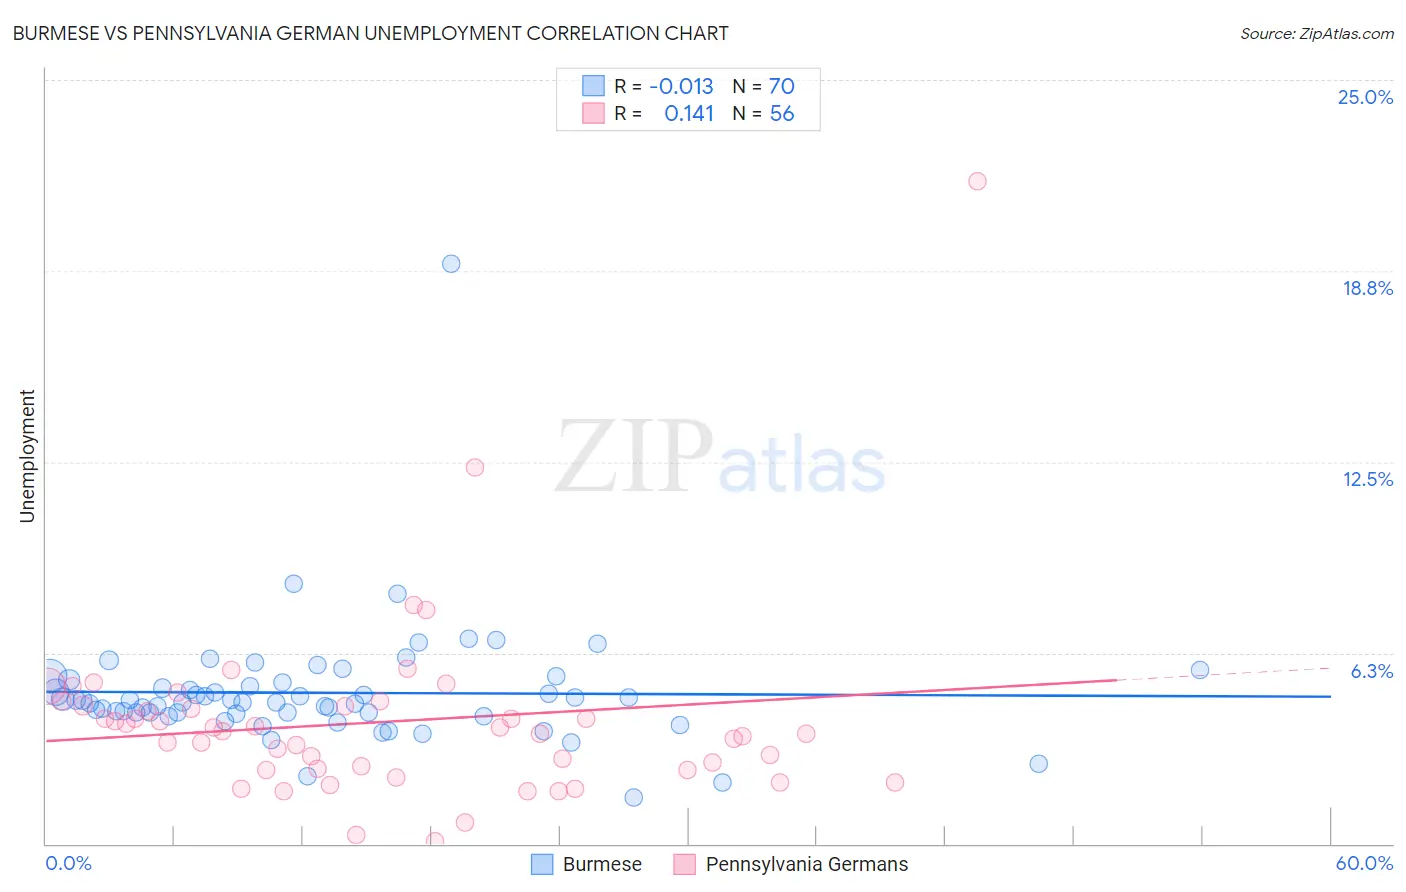
Burmese vs Pennsylvania German Unemployment Correlation Chart
The statistical analysis conducted on geographies consisting of 464,710,374 people shows no correlation between the proportion of Burmese and unemployment in the United States with a correlation coefficient (R) of -0.013 and weighted average of 4.9%. Similarly, the statistical analysis conducted on geographies consisting of 233,694,809 people shows a poor positive correlation between the proportion of Pennsylvania Germans and unemployment in the United States with a correlation coefficient (R) of 0.141 and weighted average of 4.6%, a difference of 7.0%.
Unemployment Correlation Summary
| Measurement | Burmese | Pennsylvania German |
| Minimum | 1.5% | 0.10% |
| Maximum | 19.0% | 21.7% |
| Range | 17.5% | 21.6% |
| Mean | 4.9% | 4.0% |
| Median | 4.7% | 3.6% |
| Interquartile 25% (IQ1) | 4.3% | 2.4% |
| Interquartile 75% (IQ3) | 5.3% | 4.5% |
| Interquartile Range (IQR) | 0.98% | 2.1% |
| Standard Deviation (Sample) | 2.1% | 3.1% |
| Standard Deviation (Population) | 2.1% | 3.1% |
Similar Demographics by Unemployment
Demographics Similar to Burmese by Unemployment
In terms of unemployment, the demographic groups most similar to Burmese are Immigrants from Japan (4.9%, a difference of 0.020%), Paraguayan (4.9%, a difference of 0.040%), Serbian (4.9%, a difference of 0.080%), Immigrants from Northern Europe (4.9%, a difference of 0.14%), and Immigrants from North America (4.9%, a difference of 0.23%).
| Demographics | Rating | Rank | Unemployment |
| Immigrants | Canada | 98.8 /100 | #65 | Exceptional 4.9% |
| Slovaks | 98.7 /100 | #66 | Exceptional 4.9% |
| New Zealanders | 98.6 /100 | #67 | Exceptional 4.9% |
| Slavs | 98.6 /100 | #68 | Exceptional 4.9% |
| Immigrants | North America | 98.5 /100 | #69 | Exceptional 4.9% |
| Serbians | 98.4 /100 | #70 | Exceptional 4.9% |
| Immigrants | Japan | 98.3 /100 | #71 | Exceptional 4.9% |
| Burmese | 98.3 /100 | #72 | Exceptional 4.9% |
| Paraguayans | 98.3 /100 | #73 | Exceptional 4.9% |
| Immigrants | Northern Europe | 98.2 /100 | #74 | Exceptional 4.9% |
| Turks | 98.0 /100 | #75 | Exceptional 4.9% |
| German Russians | 98.0 /100 | #76 | Exceptional 4.9% |
| Cypriots | 97.9 /100 | #77 | Exceptional 4.9% |
| Okinawans | 97.9 /100 | #78 | Exceptional 4.9% |
| Canadians | 97.7 /100 | #79 | Exceptional 5.0% |
Demographics Similar to Pennsylvania Germans by Unemployment
In terms of unemployment, the demographic groups most similar to Pennsylvania Germans are English (4.6%, a difference of 0.10%), Belgian (4.6%, a difference of 0.16%), Immigrants from Cuba (4.6%, a difference of 0.40%), Dutch (4.6%, a difference of 0.76%), and European (4.6%, a difference of 0.88%).
| Demographics | Rating | Rank | Unemployment |
| Swedes | 100.0 /100 | #5 | Exceptional 4.4% |
| Germans | 100.0 /100 | #6 | Exceptional 4.5% |
| Immigrants | India | 100.0 /100 | #7 | Exceptional 4.5% |
| Swiss | 100.0 /100 | #8 | Exceptional 4.5% |
| Scandinavians | 100.0 /100 | #9 | Exceptional 4.5% |
| Dutch | 100.0 /100 | #10 | Exceptional 4.6% |
| English | 100.0 /100 | #11 | Exceptional 4.6% |
| Pennsylvania Germans | 100.0 /100 | #12 | Exceptional 4.6% |
| Belgians | 100.0 /100 | #13 | Exceptional 4.6% |
| Immigrants | Cuba | 100.0 /100 | #14 | Exceptional 4.6% |
| Europeans | 99.9 /100 | #15 | Exceptional 4.6% |
| Chinese | 99.9 /100 | #16 | Exceptional 4.7% |
| Slovenes | 99.9 /100 | #17 | Exceptional 4.7% |
| Immigrants | Venezuela | 99.9 /100 | #18 | Exceptional 4.7% |
| Scottish | 99.9 /100 | #19 | Exceptional 4.7% |