Cheyenne vs Nicaraguan Female Unemployment
COMPARE
Cheyenne
Nicaraguan
Female Unemployment
Female Unemployment Comparison
Cheyenne
Nicaraguans
6.6%
FEMALE UNEMPLOYMENT
0.0/ 100
METRIC RATING
324th/ 347
METRIC RANK
5.5%
FEMALE UNEMPLOYMENT
7.2/ 100
METRIC RATING
222nd/ 347
METRIC RANK
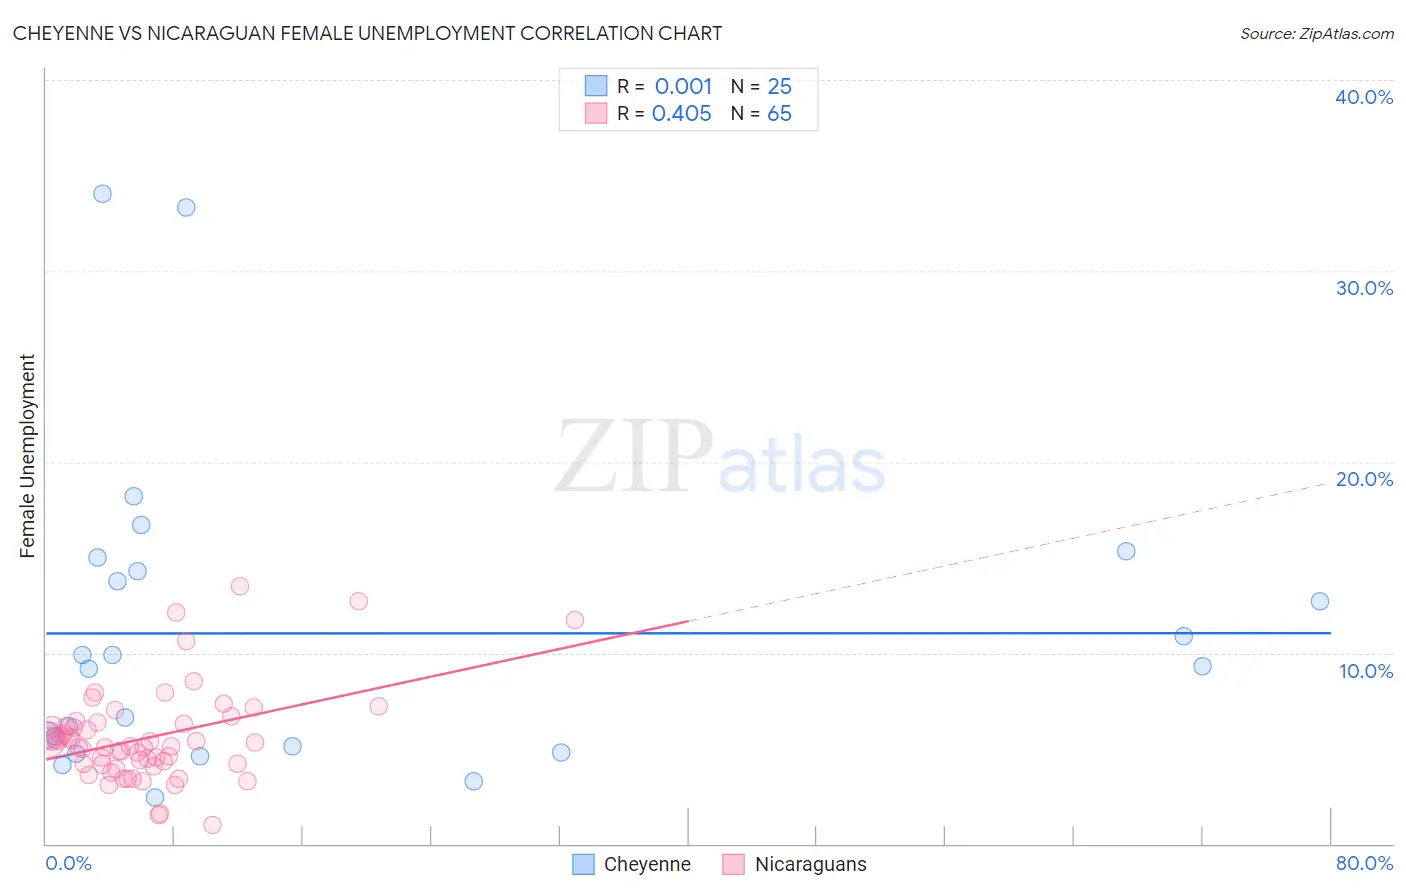
Cheyenne vs Nicaraguan Female Unemployment Correlation Chart
The statistical analysis conducted on geographies consisting of 80,481,122 people shows no correlation between the proportion of Cheyenne and unemploymnet rate among females in the United States with a correlation coefficient (R) of 0.001 and weighted average of 6.6%. Similarly, the statistical analysis conducted on geographies consisting of 285,135,127 people shows a moderate positive correlation between the proportion of Nicaraguans and unemploymnet rate among females in the United States with a correlation coefficient (R) of 0.405 and weighted average of 5.5%, a difference of 20.4%.
Female Unemployment Correlation Summary
| Measurement | Cheyenne | Nicaraguan |
| Minimum | 2.4% | 1.0% |
| Maximum | 34.0% | 13.5% |
| Range | 31.6% | 12.5% |
| Mean | 11.0% | 5.6% |
| Median | 9.3% | 5.1% |
| Interquartile 25% (IQ1) | 5.0% | 4.2% |
| Interquartile 75% (IQ3) | 14.6% | 6.3% |
| Interquartile Range (IQR) | 9.7% | 2.1% |
| Standard Deviation (Sample) | 8.2% | 2.4% |
| Standard Deviation (Population) | 8.0% | 2.4% |
Similar Demographics by Female Unemployment
Demographics Similar to Cheyenne by Female Unemployment
In terms of female unemployment, the demographic groups most similar to Cheyenne are Apache (6.6%, a difference of 0.27%), Native/Alaskan (6.6%, a difference of 0.83%), Alaska Native (6.6%, a difference of 0.91%), Immigrants from Belize (6.5%, a difference of 1.1%), and Vietnamese (6.5%, a difference of 1.2%).
| Demographics | Rating | Rank | Female Unemployment |
| Immigrants | St. Vincent and the Grenadines | 0.0 /100 | #317 | Tragic 6.4% |
| British West Indians | 0.0 /100 | #318 | Tragic 6.4% |
| Immigrants | Bangladesh | 0.0 /100 | #319 | Tragic 6.5% |
| Immigrants | Dominica | 0.0 /100 | #320 | Tragic 6.5% |
| Blacks/African Americans | 0.0 /100 | #321 | Tragic 6.5% |
| Vietnamese | 0.0 /100 | #322 | Tragic 6.5% |
| Immigrants | Belize | 0.0 /100 | #323 | Tragic 6.5% |
| Cheyenne | 0.0 /100 | #324 | Tragic 6.6% |
| Apache | 0.0 /100 | #325 | Tragic 6.6% |
| Natives/Alaskans | 0.0 /100 | #326 | Tragic 6.6% |
| Alaska Natives | 0.0 /100 | #327 | Tragic 6.6% |
| Guyanese | 0.0 /100 | #328 | Tragic 6.7% |
| Immigrants | Guyana | 0.0 /100 | #329 | Tragic 6.7% |
| Yakama | 0.0 /100 | #330 | Tragic 6.7% |
| Paiute | 0.0 /100 | #331 | Tragic 6.8% |
Demographics Similar to Nicaraguans by Female Unemployment
In terms of female unemployment, the demographic groups most similar to Nicaraguans are Delaware (5.5%, a difference of 0.010%), Brazilian (5.5%, a difference of 0.020%), Iraqi (5.5%, a difference of 0.040%), Immigrants from Africa (5.4%, a difference of 0.26%), and South American (5.4%, a difference of 0.27%).
| Demographics | Rating | Rank | Female Unemployment |
| Immigrants | Nicaragua | 10.2 /100 | #215 | Poor 5.4% |
| Comanche | 10.0 /100 | #216 | Poor 5.4% |
| Peruvians | 9.6 /100 | #217 | Tragic 5.4% |
| Bermudans | 9.0 /100 | #218 | Tragic 5.4% |
| South Americans | 8.6 /100 | #219 | Tragic 5.4% |
| Immigrants | Africa | 8.5 /100 | #220 | Tragic 5.4% |
| Brazilians | 7.3 /100 | #221 | Tragic 5.5% |
| Nicaraguans | 7.2 /100 | #222 | Tragic 5.5% |
| Delaware | 7.2 /100 | #223 | Tragic 5.5% |
| Iraqis | 7.1 /100 | #224 | Tragic 5.5% |
| French American Indians | 6.1 /100 | #225 | Tragic 5.5% |
| Immigrants | Peru | 5.9 /100 | #226 | Tragic 5.5% |
| Immigrants | Philippines | 5.3 /100 | #227 | Tragic 5.5% |
| Israelis | 4.8 /100 | #228 | Tragic 5.5% |
| Panamanians | 4.7 /100 | #229 | Tragic 5.5% |