Yakama vs Nicaraguan Female Unemployment
COMPARE
Yakama
Nicaraguan
Female Unemployment
Female Unemployment Comparison
Yakama
Nicaraguans
6.7%
FEMALE UNEMPLOYMENT
0.0/ 100
METRIC RATING
330th/ 347
METRIC RANK
5.5%
FEMALE UNEMPLOYMENT
7.2/ 100
METRIC RATING
222nd/ 347
METRIC RANK
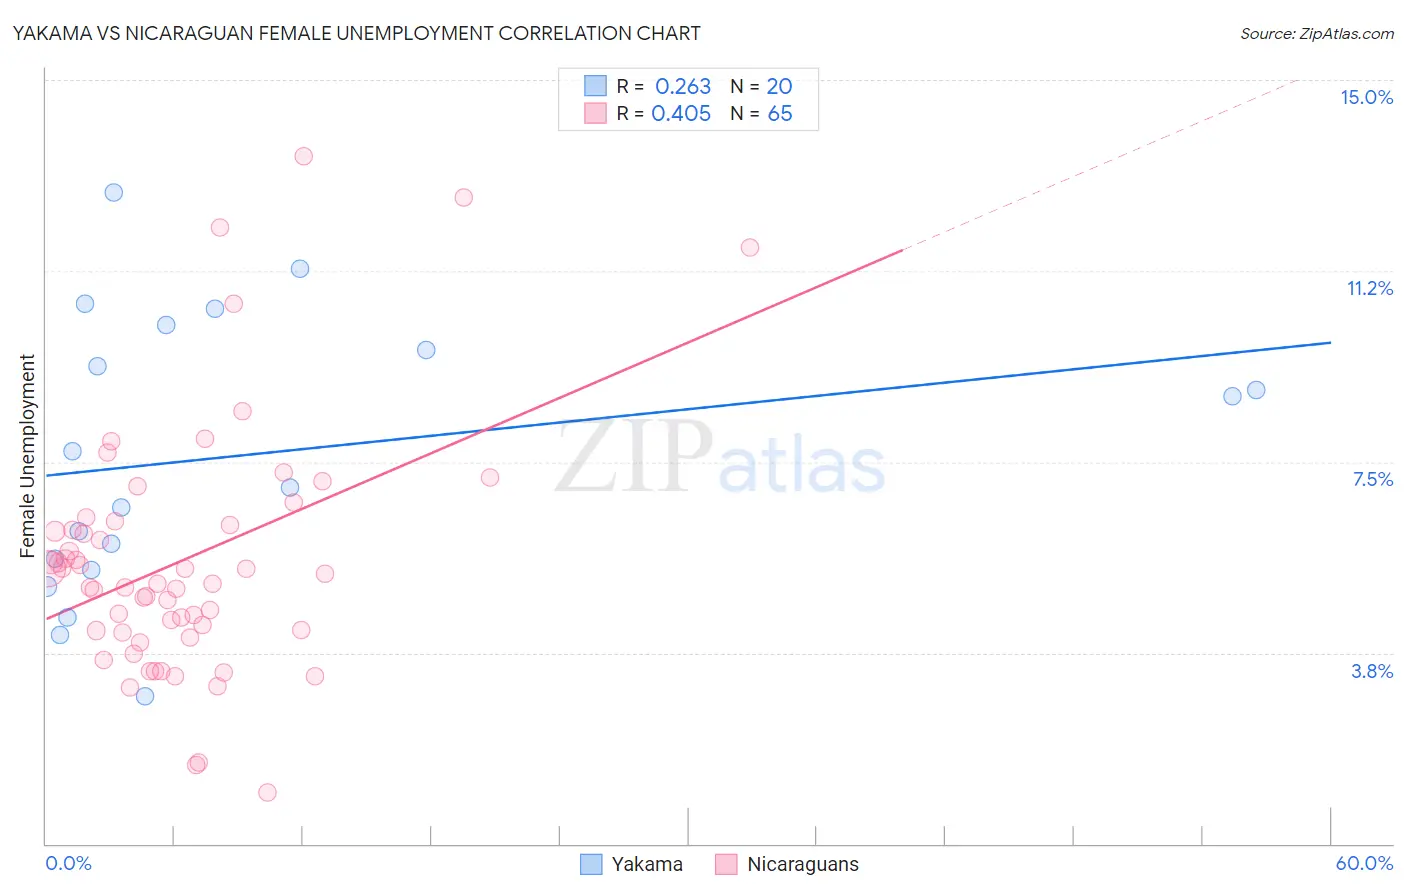
Yakama vs Nicaraguan Female Unemployment Correlation Chart
The statistical analysis conducted on geographies consisting of 19,884,840 people shows a weak positive correlation between the proportion of Yakama and unemploymnet rate among females in the United States with a correlation coefficient (R) of 0.263 and weighted average of 6.7%. Similarly, the statistical analysis conducted on geographies consisting of 285,135,127 people shows a moderate positive correlation between the proportion of Nicaraguans and unemploymnet rate among females in the United States with a correlation coefficient (R) of 0.405 and weighted average of 5.5%, a difference of 23.2%.
Female Unemployment Correlation Summary
| Measurement | Yakama | Nicaraguan |
| Minimum | 2.9% | 1.0% |
| Maximum | 12.8% | 13.5% |
| Range | 9.9% | 12.5% |
| Mean | 7.6% | 5.6% |
| Median | 7.4% | 5.1% |
| Interquartile 25% (IQ1) | 5.5% | 4.2% |
| Interquartile 75% (IQ3) | 9.9% | 6.3% |
| Interquartile Range (IQR) | 4.5% | 2.1% |
| Standard Deviation (Sample) | 2.7% | 2.4% |
| Standard Deviation (Population) | 2.7% | 2.4% |
Similar Demographics by Female Unemployment
Demographics Similar to Yakama by Female Unemployment
In terms of female unemployment, the demographic groups most similar to Yakama are Immigrants from Guyana (6.7%, a difference of 0.57%), Guyanese (6.7%, a difference of 0.94%), Paiute (6.8%, a difference of 1.1%), Alaska Native (6.6%, a difference of 1.4%), and Native/Alaskan (6.6%, a difference of 1.5%).
| Demographics | Rating | Rank | Female Unemployment |
| Immigrants | Belize | 0.0 /100 | #323 | Tragic 6.5% |
| Cheyenne | 0.0 /100 | #324 | Tragic 6.6% |
| Apache | 0.0 /100 | #325 | Tragic 6.6% |
| Natives/Alaskans | 0.0 /100 | #326 | Tragic 6.6% |
| Alaska Natives | 0.0 /100 | #327 | Tragic 6.6% |
| Guyanese | 0.0 /100 | #328 | Tragic 6.7% |
| Immigrants | Guyana | 0.0 /100 | #329 | Tragic 6.7% |
| Yakama | 0.0 /100 | #330 | Tragic 6.7% |
| Paiute | 0.0 /100 | #331 | Tragic 6.8% |
| Sioux | 0.0 /100 | #332 | Tragic 7.0% |
| Menominee | 0.0 /100 | #333 | Tragic 7.0% |
| Immigrants | Armenia | 0.0 /100 | #334 | Tragic 7.1% |
| Dominicans | 0.0 /100 | #335 | Tragic 7.2% |
| Immigrants | Dominican Republic | 0.0 /100 | #336 | Tragic 7.2% |
| Navajo | 0.0 /100 | #337 | Tragic 7.3% |
Demographics Similar to Nicaraguans by Female Unemployment
In terms of female unemployment, the demographic groups most similar to Nicaraguans are Delaware (5.5%, a difference of 0.010%), Brazilian (5.5%, a difference of 0.020%), Iraqi (5.5%, a difference of 0.040%), Immigrants from Africa (5.4%, a difference of 0.26%), and South American (5.4%, a difference of 0.27%).
| Demographics | Rating | Rank | Female Unemployment |
| Immigrants | Nicaragua | 10.2 /100 | #215 | Poor 5.4% |
| Comanche | 10.0 /100 | #216 | Poor 5.4% |
| Peruvians | 9.6 /100 | #217 | Tragic 5.4% |
| Bermudans | 9.0 /100 | #218 | Tragic 5.4% |
| South Americans | 8.6 /100 | #219 | Tragic 5.4% |
| Immigrants | Africa | 8.5 /100 | #220 | Tragic 5.4% |
| Brazilians | 7.3 /100 | #221 | Tragic 5.5% |
| Nicaraguans | 7.2 /100 | #222 | Tragic 5.5% |
| Delaware | 7.2 /100 | #223 | Tragic 5.5% |
| Iraqis | 7.1 /100 | #224 | Tragic 5.5% |
| French American Indians | 6.1 /100 | #225 | Tragic 5.5% |
| Immigrants | Peru | 5.9 /100 | #226 | Tragic 5.5% |
| Immigrants | Philippines | 5.3 /100 | #227 | Tragic 5.5% |
| Israelis | 4.8 /100 | #228 | Tragic 5.5% |
| Panamanians | 4.7 /100 | #229 | Tragic 5.5% |