Bulgarian vs Nicaraguan Median Male Earnings
COMPARE
Bulgarian
Nicaraguan
Median Male Earnings
Median Male Earnings Comparison
Bulgarians
Nicaraguans
$62,378
MEDIAN MALE EARNINGS
100.0/ 100
METRIC RATING
45th/ 347
METRIC RANK
$49,215
MEDIAN MALE EARNINGS
0.6/ 100
METRIC RATING
263rd/ 347
METRIC RANK
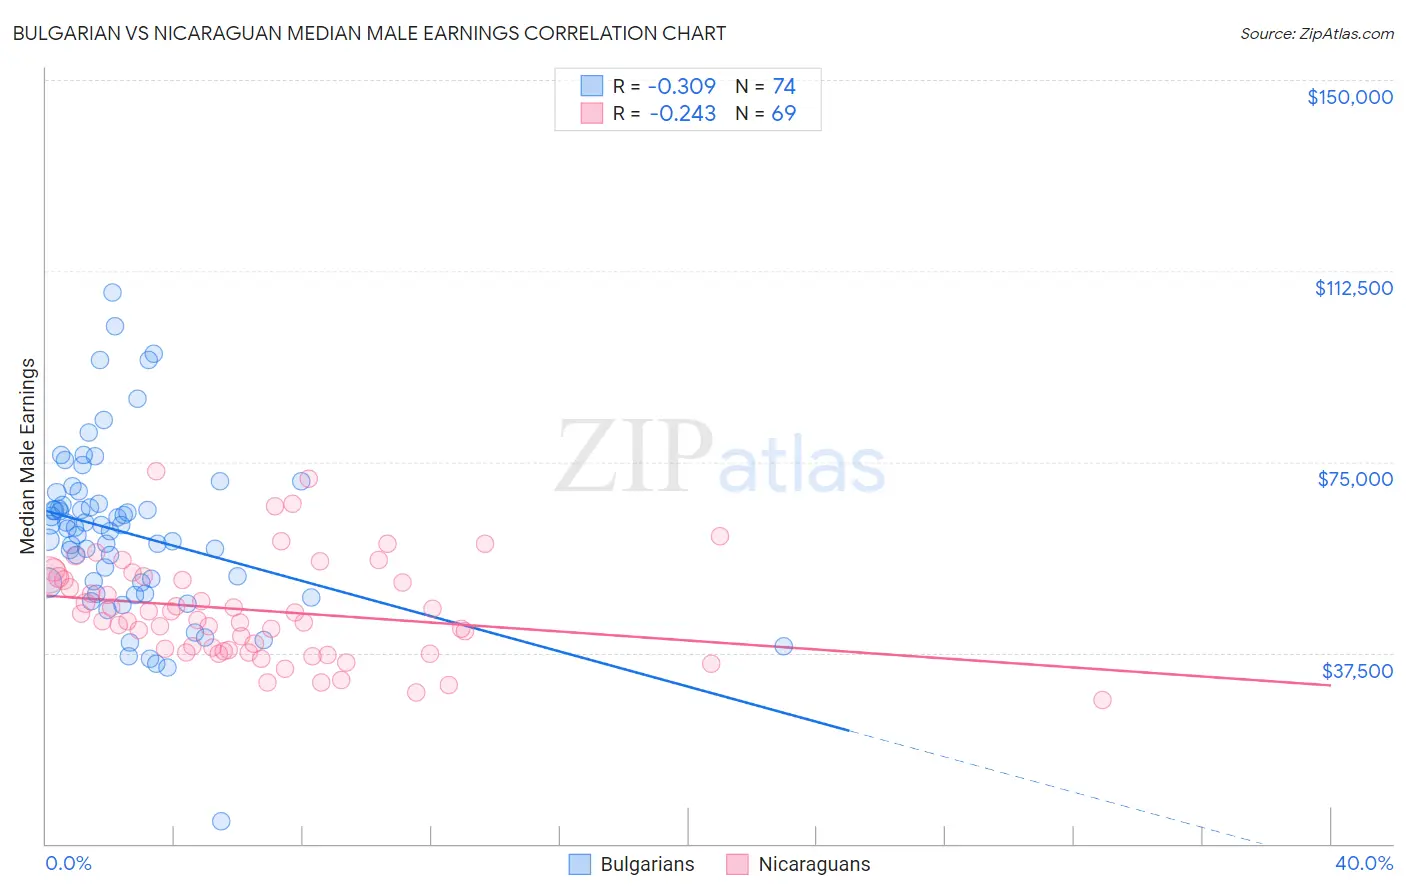
Bulgarian vs Nicaraguan Median Male Earnings Correlation Chart
The statistical analysis conducted on geographies consisting of 205,598,511 people shows a mild negative correlation between the proportion of Bulgarians and median male earnings in the United States with a correlation coefficient (R) of -0.309 and weighted average of $62,378. Similarly, the statistical analysis conducted on geographies consisting of 285,681,688 people shows a weak negative correlation between the proportion of Nicaraguans and median male earnings in the United States with a correlation coefficient (R) of -0.243 and weighted average of $49,215, a difference of 26.8%.
Median Male Earnings Correlation Summary
| Measurement | Bulgarian | Nicaraguan |
| Minimum | $4,447 | $28,353 |
| Maximum | $108,199 | $73,045 |
| Range | $103,752 | $44,692 |
| Mean | $60,992 | $45,837 |
| Median | $62,011 | $43,824 |
| Interquartile 25% (IQ1) | $51,254 | $37,970 |
| Interquartile 75% (IQ3) | $66,727 | $52,426 |
| Interquartile Range (IQR) | $15,473 | $14,456 |
| Standard Deviation (Sample) | $16,836 | $9,879 |
| Standard Deviation (Population) | $16,722 | $9,808 |
Similar Demographics by Median Male Earnings
Demographics Similar to Bulgarians by Median Male Earnings
In terms of median male earnings, the demographic groups most similar to Bulgarians are Cambodian ($62,516, a difference of 0.22%), Immigrants from Czechoslovakia ($62,217, a difference of 0.26%), Immigrants from Austria ($62,164, a difference of 0.35%), Immigrants from Malaysia ($62,121, a difference of 0.41%), and Immigrants from Belarus ($62,658, a difference of 0.45%).
| Demographics | Rating | Rank | Median Male Earnings |
| Maltese | 100.0 /100 | #38 | Exceptional $62,953 |
| Immigrants | South Africa | 100.0 /100 | #39 | Exceptional $62,899 |
| Australians | 100.0 /100 | #40 | Exceptional $62,857 |
| Immigrants | Turkey | 100.0 /100 | #41 | Exceptional $62,728 |
| Immigrants | Greece | 100.0 /100 | #42 | Exceptional $62,689 |
| Immigrants | Belarus | 100.0 /100 | #43 | Exceptional $62,658 |
| Cambodians | 100.0 /100 | #44 | Exceptional $62,516 |
| Bulgarians | 100.0 /100 | #45 | Exceptional $62,378 |
| Immigrants | Czechoslovakia | 99.9 /100 | #46 | Exceptional $62,217 |
| Immigrants | Austria | 99.9 /100 | #47 | Exceptional $62,164 |
| Immigrants | Malaysia | 99.9 /100 | #48 | Exceptional $62,121 |
| Immigrants | Europe | 99.9 /100 | #49 | Exceptional $62,057 |
| Bhutanese | 99.9 /100 | #50 | Exceptional $61,759 |
| Estonians | 99.9 /100 | #51 | Exceptional $61,710 |
| Immigrants | Norway | 99.9 /100 | #52 | Exceptional $61,628 |
Demographics Similar to Nicaraguans by Median Male Earnings
In terms of median male earnings, the demographic groups most similar to Nicaraguans are Immigrants from Middle Africa ($49,201, a difference of 0.030%), Immigrants from Laos ($49,190, a difference of 0.050%), Immigrants from West Indies ($49,271, a difference of 0.11%), Liberian ($49,318, a difference of 0.21%), and Iroquois ($49,374, a difference of 0.32%).
| Demographics | Rating | Rank | Median Male Earnings |
| Alaska Natives | 0.9 /100 | #256 | Tragic $49,711 |
| British West Indians | 0.8 /100 | #257 | Tragic $49,636 |
| Cree | 0.7 /100 | #258 | Tragic $49,497 |
| Nepalese | 0.7 /100 | #259 | Tragic $49,458 |
| Iroquois | 0.7 /100 | #260 | Tragic $49,374 |
| Liberians | 0.6 /100 | #261 | Tragic $49,318 |
| Immigrants | West Indies | 0.6 /100 | #262 | Tragic $49,271 |
| Nicaraguans | 0.6 /100 | #263 | Tragic $49,215 |
| Immigrants | Middle Africa | 0.6 /100 | #264 | Tragic $49,201 |
| Immigrants | Laos | 0.6 /100 | #265 | Tragic $49,190 |
| Somalis | 0.5 /100 | #266 | Tragic $49,025 |
| Spanish Americans | 0.5 /100 | #267 | Tragic $49,008 |
| Ute | 0.4 /100 | #268 | Tragic $48,899 |
| Tsimshian | 0.4 /100 | #269 | Tragic $48,836 |
| Potawatomi | 0.4 /100 | #270 | Tragic $48,768 |