Jamaican vs Immigrants from Hong Kong Female Unemployment
COMPARE
Jamaican
Immigrants from Hong Kong
Female Unemployment
Female Unemployment Comparison
Jamaicans
Immigrants from Hong Kong
6.1%
FEMALE UNEMPLOYMENT
0.0/ 100
METRIC RATING
298th/ 347
METRIC RANK
5.1%
FEMALE UNEMPLOYMENT
84.8/ 100
METRIC RATING
133rd/ 347
METRIC RANK
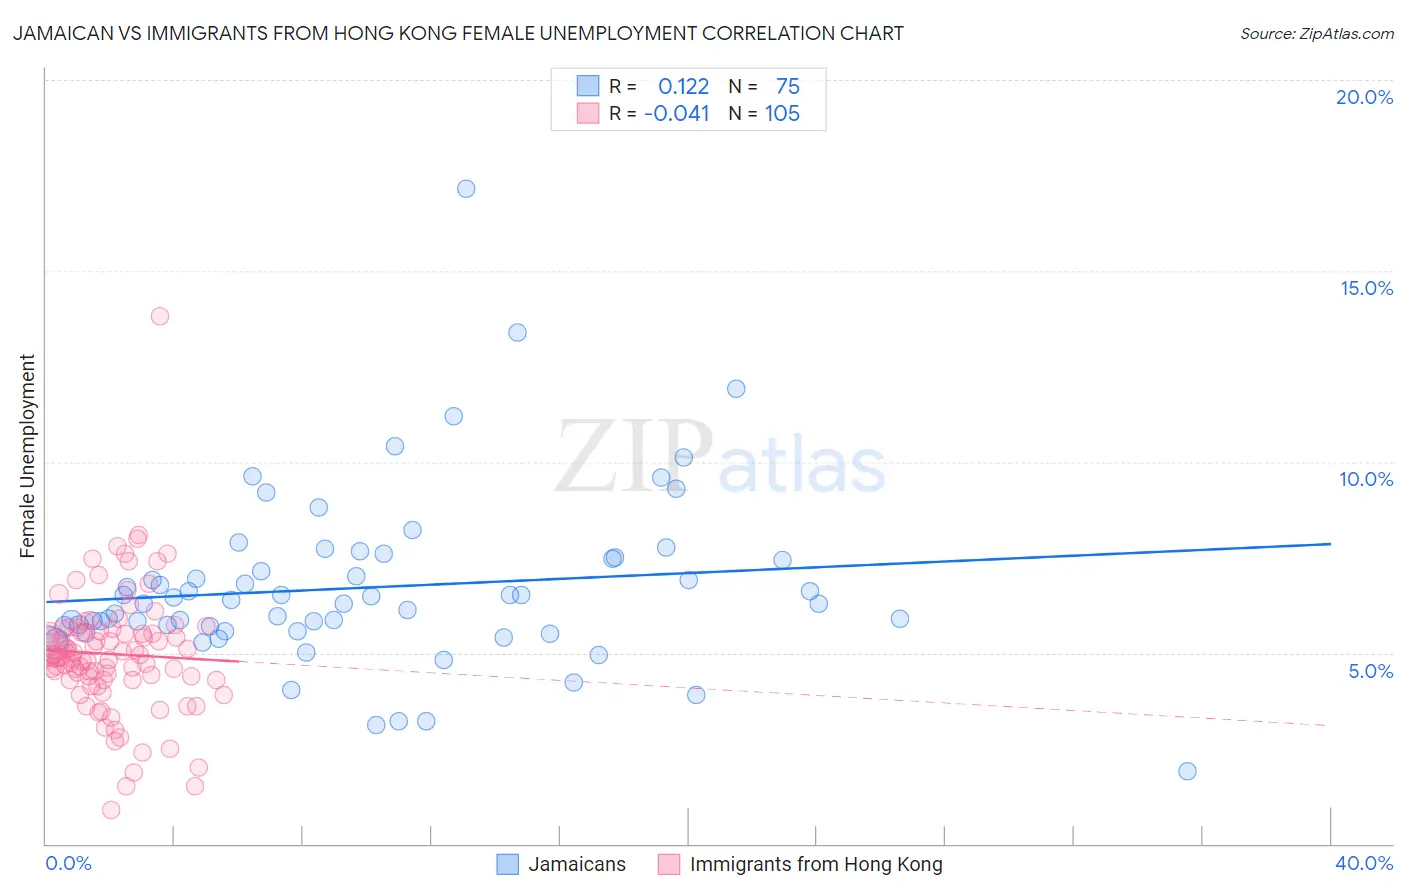
Jamaican vs Immigrants from Hong Kong Female Unemployment Correlation Chart
The statistical analysis conducted on geographies consisting of 366,799,566 people shows a poor positive correlation between the proportion of Jamaicans and unemploymnet rate among females in the United States with a correlation coefficient (R) of 0.122 and weighted average of 6.1%. Similarly, the statistical analysis conducted on geographies consisting of 253,623,871 people shows no correlation between the proportion of Immigrants from Hong Kong and unemploymnet rate among females in the United States with a correlation coefficient (R) of -0.041 and weighted average of 5.1%, a difference of 19.6%.
Female Unemployment Correlation Summary
| Measurement | Jamaican | Immigrants from Hong Kong |
| Minimum | 1.9% | 0.90% |
| Maximum | 17.2% | 13.8% |
| Range | 15.3% | 12.9% |
| Mean | 6.7% | 5.0% |
| Median | 6.3% | 4.9% |
| Interquartile 25% (IQ1) | 5.6% | 4.3% |
| Interquartile 75% (IQ3) | 7.5% | 5.6% |
| Interquartile Range (IQR) | 1.9% | 1.3% |
| Standard Deviation (Sample) | 2.3% | 1.6% |
| Standard Deviation (Population) | 2.3% | 1.6% |
Similar Demographics by Female Unemployment
Demographics Similar to Jamaicans by Female Unemployment
In terms of female unemployment, the demographic groups most similar to Jamaicans are West Indian (6.1%, a difference of 0.020%), Alaskan Athabascan (6.1%, a difference of 0.030%), Immigrants from Latin America (6.1%, a difference of 0.050%), Ute (6.1%, a difference of 0.10%), and Immigrants from Haiti (6.1%, a difference of 0.15%).
| Demographics | Rating | Rank | Female Unemployment |
| Immigrants | West Indies | 0.0 /100 | #291 | Tragic 6.1% |
| Immigrants | Trinidad and Tobago | 0.0 /100 | #292 | Tragic 6.1% |
| Mexicans | 0.0 /100 | #293 | Tragic 6.1% |
| Immigrants | El Salvador | 0.0 /100 | #294 | Tragic 6.1% |
| Immigrants | Latin America | 0.0 /100 | #295 | Tragic 6.1% |
| Alaskan Athabascans | 0.0 /100 | #296 | Tragic 6.1% |
| West Indians | 0.0 /100 | #297 | Tragic 6.1% |
| Jamaicans | 0.0 /100 | #298 | Tragic 6.1% |
| Ute | 0.0 /100 | #299 | Tragic 6.1% |
| Immigrants | Haiti | 0.0 /100 | #300 | Tragic 6.1% |
| Immigrants | Barbados | 0.0 /100 | #301 | Tragic 6.2% |
| U.S. Virgin Islanders | 0.0 /100 | #302 | Tragic 6.2% |
| Barbadians | 0.0 /100 | #303 | Tragic 6.2% |
| Immigrants | Jamaica | 0.0 /100 | #304 | Tragic 6.2% |
| Spanish American Indians | 0.0 /100 | #305 | Tragic 6.2% |
Demographics Similar to Immigrants from Hong Kong by Female Unemployment
In terms of female unemployment, the demographic groups most similar to Immigrants from Hong Kong are Immigrants from Sri Lanka (5.1%, a difference of 0.020%), Immigrants from Eritrea (5.1%, a difference of 0.020%), Immigrants from Latvia (5.1%, a difference of 0.030%), Immigrants from Ethiopia (5.1%, a difference of 0.070%), and Indian (Asian) (5.1%, a difference of 0.070%).
| Demographics | Rating | Rank | Female Unemployment |
| Immigrants | Korea | 86.3 /100 | #126 | Excellent 5.1% |
| Immigrants | Hungary | 86.0 /100 | #127 | Excellent 5.1% |
| Chileans | 85.8 /100 | #128 | Excellent 5.1% |
| Ethiopians | 85.7 /100 | #129 | Excellent 5.1% |
| Maltese | 85.5 /100 | #130 | Excellent 5.1% |
| Immigrants | Ethiopia | 85.4 /100 | #131 | Excellent 5.1% |
| Immigrants | Sri Lanka | 85.0 /100 | #132 | Excellent 5.1% |
| Immigrants | Hong Kong | 84.8 /100 | #133 | Excellent 5.1% |
| Immigrants | Eritrea | 84.6 /100 | #134 | Excellent 5.1% |
| Immigrants | Latvia | 84.6 /100 | #135 | Excellent 5.1% |
| Indians (Asian) | 84.2 /100 | #136 | Excellent 5.1% |
| Pakistanis | 83.8 /100 | #137 | Excellent 5.1% |
| Chickasaw | 83.2 /100 | #138 | Excellent 5.1% |
| Immigrants | Eastern Asia | 83.0 /100 | #139 | Excellent 5.1% |
| Immigrants | France | 82.7 /100 | #140 | Excellent 5.1% |