Brazilian vs Immigrants from Western Asia Female Unemployment
COMPARE
Brazilian
Immigrants from Western Asia
Female Unemployment
Female Unemployment Comparison
Brazilians
Immigrants from Western Asia
5.5%
FEMALE UNEMPLOYMENT
7.3/ 100
METRIC RATING
221st/ 347
METRIC RANK
5.6%
FEMALE UNEMPLOYMENT
1.1/ 100
METRIC RATING
247th/ 347
METRIC RANK
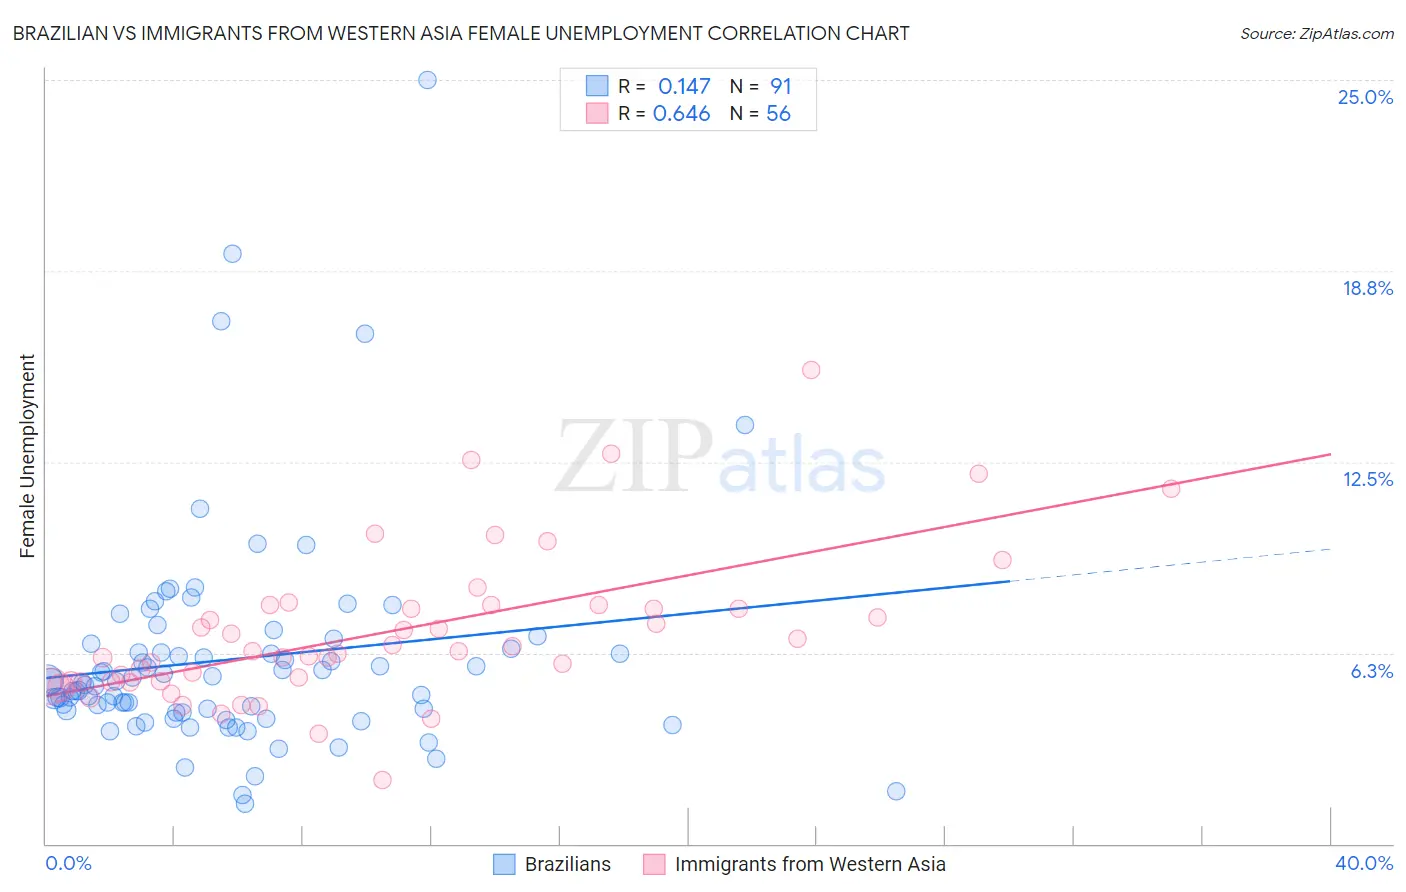
Brazilian vs Immigrants from Western Asia Female Unemployment Correlation Chart
The statistical analysis conducted on geographies consisting of 323,090,102 people shows a poor positive correlation between the proportion of Brazilians and unemploymnet rate among females in the United States with a correlation coefficient (R) of 0.147 and weighted average of 5.5%. Similarly, the statistical analysis conducted on geographies consisting of 402,949,071 people shows a significant positive correlation between the proportion of Immigrants from Western Asia and unemploymnet rate among females in the United States with a correlation coefficient (R) of 0.646 and weighted average of 5.6%, a difference of 2.8%.
Female Unemployment Correlation Summary
| Measurement | Brazilian | Immigrants from Western Asia |
| Minimum | 1.3% | 2.1% |
| Maximum | 25.0% | 15.5% |
| Range | 23.7% | 13.4% |
| Mean | 6.0% | 6.9% |
| Median | 5.3% | 6.3% |
| Interquartile 25% (IQ1) | 4.3% | 5.3% |
| Interquartile 75% (IQ3) | 6.4% | 7.8% |
| Interquartile Range (IQR) | 2.1% | 2.5% |
| Standard Deviation (Sample) | 3.6% | 2.5% |
| Standard Deviation (Population) | 3.6% | 2.5% |
Similar Demographics by Female Unemployment
Demographics Similar to Brazilians by Female Unemployment
In terms of female unemployment, the demographic groups most similar to Brazilians are Nicaraguan (5.5%, a difference of 0.020%), Delaware (5.5%, a difference of 0.030%), Iraqi (5.5%, a difference of 0.060%), Immigrants from Africa (5.4%, a difference of 0.25%), and South American (5.4%, a difference of 0.26%).
| Demographics | Rating | Rank | Female Unemployment |
| Seminole | 10.3 /100 | #214 | Poor 5.4% |
| Immigrants | Nicaragua | 10.2 /100 | #215 | Poor 5.4% |
| Comanche | 10.0 /100 | #216 | Poor 5.4% |
| Peruvians | 9.6 /100 | #217 | Tragic 5.4% |
| Bermudans | 9.0 /100 | #218 | Tragic 5.4% |
| South Americans | 8.6 /100 | #219 | Tragic 5.4% |
| Immigrants | Africa | 8.5 /100 | #220 | Tragic 5.4% |
| Brazilians | 7.3 /100 | #221 | Tragic 5.5% |
| Nicaraguans | 7.2 /100 | #222 | Tragic 5.5% |
| Delaware | 7.2 /100 | #223 | Tragic 5.5% |
| Iraqis | 7.1 /100 | #224 | Tragic 5.5% |
| French American Indians | 6.1 /100 | #225 | Tragic 5.5% |
| Immigrants | Peru | 5.9 /100 | #226 | Tragic 5.5% |
| Immigrants | Philippines | 5.3 /100 | #227 | Tragic 5.5% |
| Israelis | 4.8 /100 | #228 | Tragic 5.5% |
Demographics Similar to Immigrants from Western Asia by Female Unemployment
In terms of female unemployment, the demographic groups most similar to Immigrants from Western Asia are Japanese (5.6%, a difference of 0.080%), Cree (5.6%, a difference of 0.16%), Immigrants from Uzbekistan (5.6%, a difference of 0.20%), Guamanian/Chamorro (5.6%, a difference of 0.31%), and Immigrants from Liberia (5.6%, a difference of 0.45%).
| Demographics | Rating | Rank | Female Unemployment |
| Immigrants | South America | 2.9 /100 | #240 | Tragic 5.5% |
| South American Indians | 2.8 /100 | #241 | Tragic 5.5% |
| Marshallese | 2.3 /100 | #242 | Tragic 5.6% |
| Spanish Americans | 2.2 /100 | #243 | Tragic 5.6% |
| Immigrants | Liberia | 1.5 /100 | #244 | Tragic 5.6% |
| Guamanians/Chamorros | 1.4 /100 | #245 | Tragic 5.6% |
| Japanese | 1.2 /100 | #246 | Tragic 5.6% |
| Immigrants | Western Asia | 1.1 /100 | #247 | Tragic 5.6% |
| Cree | 1.0 /100 | #248 | Tragic 5.6% |
| Immigrants | Uzbekistan | 1.0 /100 | #249 | Tragic 5.6% |
| Immigrants | Syria | 0.8 /100 | #250 | Tragic 5.6% |
| Assyrians/Chaldeans/Syriacs | 0.8 /100 | #251 | Tragic 5.6% |
| Cajuns | 0.7 /100 | #252 | Tragic 5.7% |
| Immigrants | Sierra Leone | 0.6 /100 | #253 | Tragic 5.7% |
| Immigrants | Immigrants | 0.6 /100 | #254 | Tragic 5.7% |