Brazilian vs Immigrants from Switzerland Female Unemployment
COMPARE
Brazilian
Immigrants from Switzerland
Female Unemployment
Female Unemployment Comparison
Brazilians
Immigrants from Switzerland
5.5%
FEMALE UNEMPLOYMENT
7.3/ 100
METRIC RATING
221st/ 347
METRIC RANK
5.1%
FEMALE UNEMPLOYMENT
93.1/ 100
METRIC RATING
107th/ 347
METRIC RANK
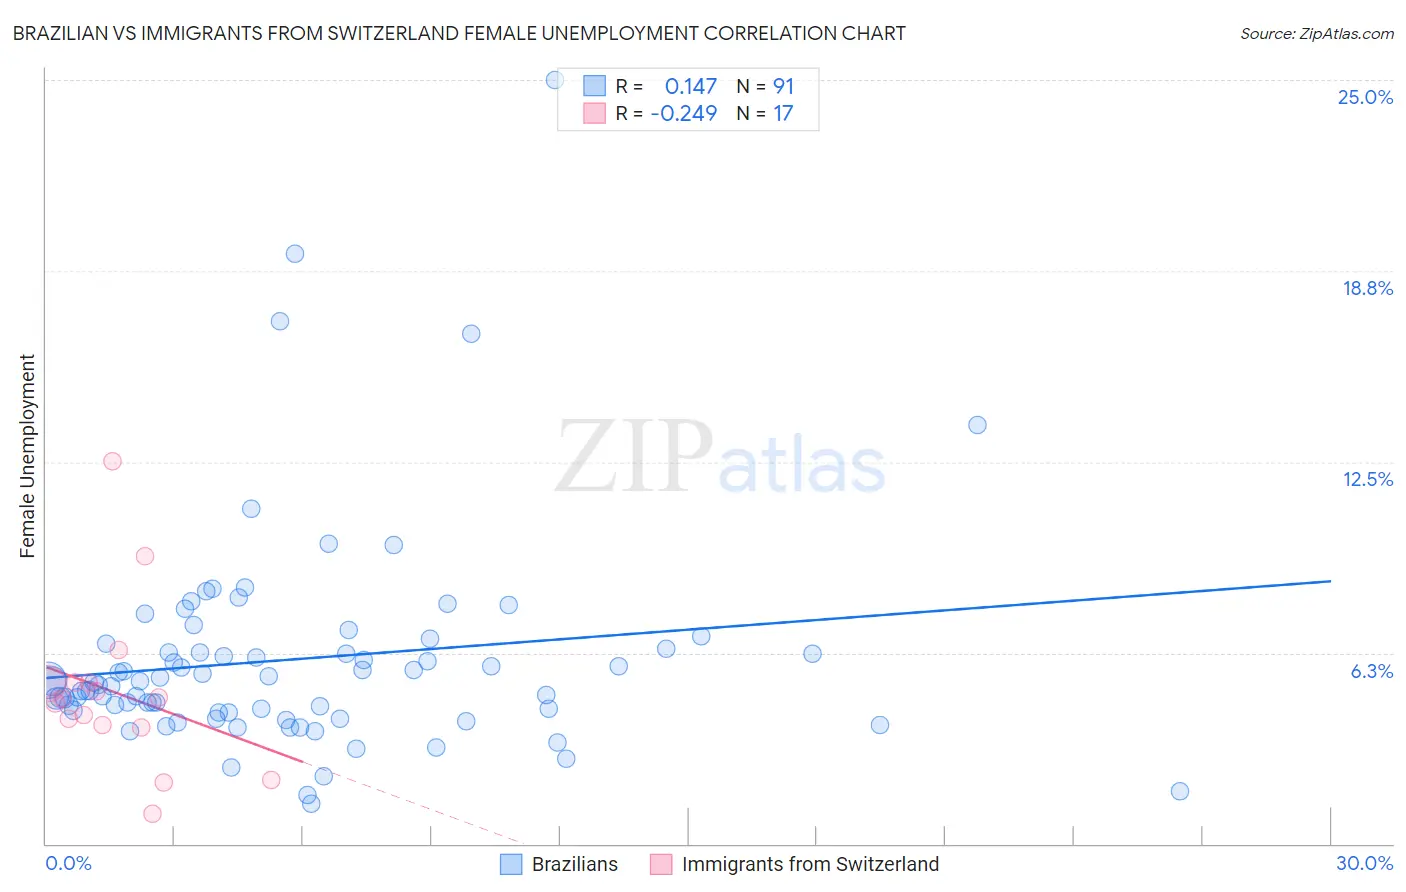
Brazilian vs Immigrants from Switzerland Female Unemployment Correlation Chart
The statistical analysis conducted on geographies consisting of 323,090,102 people shows a poor positive correlation between the proportion of Brazilians and unemploymnet rate among females in the United States with a correlation coefficient (R) of 0.147 and weighted average of 5.5%. Similarly, the statistical analysis conducted on geographies consisting of 147,831,488 people shows a weak negative correlation between the proportion of Immigrants from Switzerland and unemploymnet rate among females in the United States with a correlation coefficient (R) of -0.249 and weighted average of 5.1%, a difference of 8.0%.
Female Unemployment Correlation Summary
| Measurement | Brazilian | Immigrants from Switzerland |
| Minimum | 1.3% | 1.0% |
| Maximum | 25.0% | 12.5% |
| Range | 23.7% | 11.5% |
| Mean | 6.0% | 5.0% |
| Median | 5.3% | 4.7% |
| Interquartile 25% (IQ1) | 4.3% | 3.8% |
| Interquartile 75% (IQ3) | 6.4% | 5.3% |
| Interquartile Range (IQR) | 2.1% | 1.4% |
| Standard Deviation (Sample) | 3.6% | 2.7% |
| Standard Deviation (Population) | 3.6% | 2.6% |
Similar Demographics by Female Unemployment
Demographics Similar to Brazilians by Female Unemployment
In terms of female unemployment, the demographic groups most similar to Brazilians are Nicaraguan (5.5%, a difference of 0.020%), Delaware (5.5%, a difference of 0.030%), Iraqi (5.5%, a difference of 0.060%), Immigrants from Africa (5.4%, a difference of 0.25%), and South American (5.4%, a difference of 0.26%).
| Demographics | Rating | Rank | Female Unemployment |
| Seminole | 10.3 /100 | #214 | Poor 5.4% |
| Immigrants | Nicaragua | 10.2 /100 | #215 | Poor 5.4% |
| Comanche | 10.0 /100 | #216 | Poor 5.4% |
| Peruvians | 9.6 /100 | #217 | Tragic 5.4% |
| Bermudans | 9.0 /100 | #218 | Tragic 5.4% |
| South Americans | 8.6 /100 | #219 | Tragic 5.4% |
| Immigrants | Africa | 8.5 /100 | #220 | Tragic 5.4% |
| Brazilians | 7.3 /100 | #221 | Tragic 5.5% |
| Nicaraguans | 7.2 /100 | #222 | Tragic 5.5% |
| Delaware | 7.2 /100 | #223 | Tragic 5.5% |
| Iraqis | 7.1 /100 | #224 | Tragic 5.5% |
| French American Indians | 6.1 /100 | #225 | Tragic 5.5% |
| Immigrants | Peru | 5.9 /100 | #226 | Tragic 5.5% |
| Immigrants | Philippines | 5.3 /100 | #227 | Tragic 5.5% |
| Israelis | 4.8 /100 | #228 | Tragic 5.5% |
Demographics Similar to Immigrants from Switzerland by Female Unemployment
In terms of female unemployment, the demographic groups most similar to Immigrants from Switzerland are Puget Sound Salish (5.1%, a difference of 0.020%), Paraguayan (5.1%, a difference of 0.030%), Immigrants from Eastern Africa (5.1%, a difference of 0.060%), Immigrants from England (5.0%, a difference of 0.12%), and Kenyan (5.0%, a difference of 0.15%).
| Demographics | Rating | Rank | Female Unemployment |
| Indonesians | 95.1 /100 | #100 | Exceptional 5.0% |
| Immigrants | Czechoslovakia | 95.0 /100 | #101 | Exceptional 5.0% |
| Immigrants | Kenya | 94.8 /100 | #102 | Exceptional 5.0% |
| Somalis | 94.6 /100 | #103 | Exceptional 5.0% |
| Kenyans | 93.7 /100 | #104 | Exceptional 5.0% |
| Immigrants | England | 93.6 /100 | #105 | Exceptional 5.0% |
| Paraguayans | 93.2 /100 | #106 | Exceptional 5.1% |
| Immigrants | Switzerland | 93.1 /100 | #107 | Exceptional 5.1% |
| Puget Sound Salish | 93.0 /100 | #108 | Exceptional 5.1% |
| Immigrants | Eastern Africa | 92.8 /100 | #109 | Exceptional 5.1% |
| Macedonians | 92.4 /100 | #110 | Exceptional 5.1% |
| Immigrants | Burma/Myanmar | 92.3 /100 | #111 | Exceptional 5.1% |
| Estonians | 92.1 /100 | #112 | Exceptional 5.1% |
| Immigrants | Saudi Arabia | 91.2 /100 | #113 | Exceptional 5.1% |
| Immigrants | Turkey | 91.0 /100 | #114 | Exceptional 5.1% |