Immigrants from Lithuania vs Portuguese Unemployment Among Youth under 25 years
COMPARE
Immigrants from Lithuania
Portuguese
Unemployment Among Youth under 25 years
Unemployment Among Youth under 25 years Comparison
Immigrants from Lithuania
Portuguese
11.3%
UNEMPLOYMENT AMONG YOUTH UNDER 25 YEARS
92.9/ 100
METRIC RATING
107th/ 347
METRIC RANK
11.7%
UNEMPLOYMENT AMONG YOUTH UNDER 25 YEARS
30.3/ 100
METRIC RATING
190th/ 347
METRIC RANK
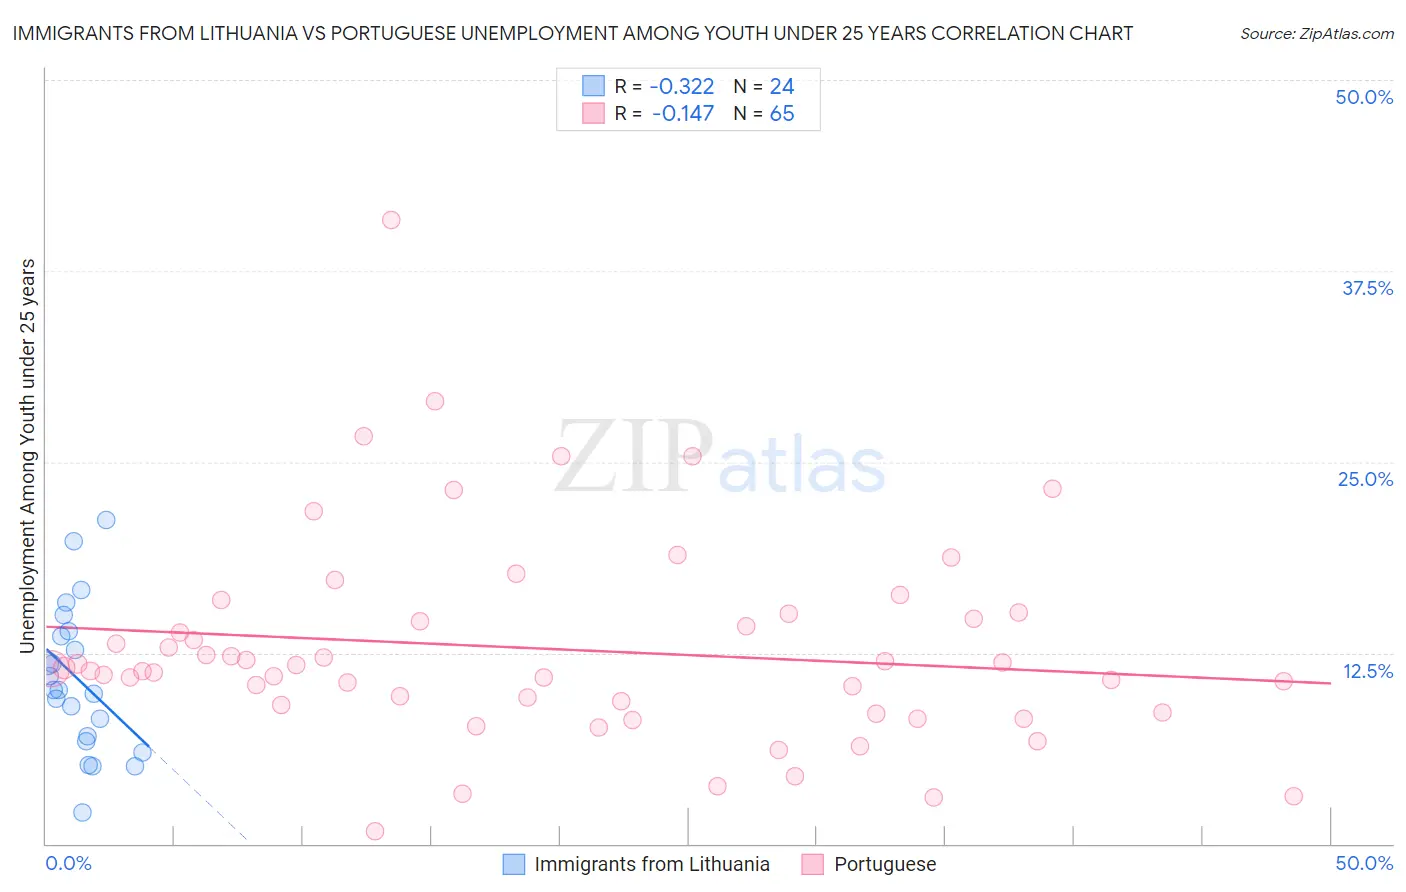
Immigrants from Lithuania vs Portuguese Unemployment Among Youth under 25 years Correlation Chart
The statistical analysis conducted on geographies consisting of 117,251,383 people shows a mild negative correlation between the proportion of Immigrants from Lithuania and unemployment rate among youth under the age of 25 in the United States with a correlation coefficient (R) of -0.322 and weighted average of 11.3%. Similarly, the statistical analysis conducted on geographies consisting of 441,524,609 people shows a poor negative correlation between the proportion of Portuguese and unemployment rate among youth under the age of 25 in the United States with a correlation coefficient (R) of -0.147 and weighted average of 11.7%, a difference of 3.6%.
Unemployment Among Youth under 25 years Correlation Summary
| Measurement | Immigrants from Lithuania | Portuguese |
| Minimum | 2.0% | 0.80% |
| Maximum | 21.2% | 40.8% |
| Range | 19.1% | 40.0% |
| Mean | 10.7% | 12.7% |
| Median | 10.1% | 11.4% |
| Interquartile 25% (IQ1) | 6.9% | 8.9% |
| Interquartile 75% (IQ3) | 13.7% | 14.9% |
| Interquartile Range (IQR) | 6.9% | 6.0% |
| Standard Deviation (Sample) | 4.8% | 6.8% |
| Standard Deviation (Population) | 4.7% | 6.8% |
Similar Demographics by Unemployment Among Youth under 25 years
Demographics Similar to Immigrants from Lithuania by Unemployment Among Youth under 25 years
In terms of unemployment among youth under 25 years, the demographic groups most similar to Immigrants from Lithuania are Immigrants from Kuwait (11.3%, a difference of 0.010%), Chilean (11.3%, a difference of 0.020%), Immigrants from Jordan (11.3%, a difference of 0.030%), Immigrants from Afghanistan (11.3%, a difference of 0.090%), and Immigrants from Thailand (11.3%, a difference of 0.11%).
| Demographics | Rating | Rank | Unemployment Among Youth under 25 years |
| Pakistanis | 94.0 /100 | #100 | Exceptional 11.3% |
| Iroquois | 93.8 /100 | #101 | Exceptional 11.3% |
| Immigrants | Thailand | 93.6 /100 | #102 | Exceptional 11.3% |
| Immigrants | Malaysia | 93.6 /100 | #103 | Exceptional 11.3% |
| Immigrants | Afghanistan | 93.4 /100 | #104 | Exceptional 11.3% |
| Immigrants | Jordan | 93.1 /100 | #105 | Exceptional 11.3% |
| Chileans | 93.0 /100 | #106 | Exceptional 11.3% |
| Immigrants | Lithuania | 92.9 /100 | #107 | Exceptional 11.3% |
| Immigrants | Kuwait | 92.9 /100 | #108 | Exceptional 11.3% |
| Iranians | 92.0 /100 | #109 | Exceptional 11.3% |
| Immigrants | Norway | 91.5 /100 | #110 | Exceptional 11.3% |
| Immigrants | France | 90.3 /100 | #111 | Exceptional 11.3% |
| Immigrants | Austria | 90.3 /100 | #112 | Exceptional 11.3% |
| Fijians | 90.2 /100 | #113 | Exceptional 11.3% |
| Immigrants | Ethiopia | 89.9 /100 | #114 | Excellent 11.3% |
Demographics Similar to Portuguese by Unemployment Among Youth under 25 years
In terms of unemployment among youth under 25 years, the demographic groups most similar to Portuguese are Japanese (11.7%, a difference of 0.020%), Immigrants from Poland (11.7%, a difference of 0.050%), Immigrants from Egypt (11.7%, a difference of 0.080%), Cypriot (11.7%, a difference of 0.090%), and Immigrants from Russia (11.7%, a difference of 0.090%).
| Demographics | Rating | Rank | Unemployment Among Youth under 25 years |
| Americans | 34.5 /100 | #183 | Fair 11.7% |
| Immigrants | Eastern Europe | 34.1 /100 | #184 | Fair 11.7% |
| French American Indians | 34.0 /100 | #185 | Fair 11.7% |
| Maltese | 33.9 /100 | #186 | Fair 11.7% |
| Immigrants | Egypt | 31.9 /100 | #187 | Fair 11.7% |
| Immigrants | Poland | 31.4 /100 | #188 | Fair 11.7% |
| Japanese | 30.8 /100 | #189 | Fair 11.7% |
| Portuguese | 30.3 /100 | #190 | Fair 11.7% |
| Cypriots | 28.5 /100 | #191 | Fair 11.7% |
| Immigrants | Russia | 28.5 /100 | #192 | Fair 11.7% |
| Seminole | 27.9 /100 | #193 | Fair 11.7% |
| Immigrants | Sri Lanka | 27.8 /100 | #194 | Fair 11.7% |
| Paraguayans | 27.2 /100 | #195 | Fair 11.7% |
| Egyptians | 26.9 /100 | #196 | Fair 11.7% |
| Koreans | 23.9 /100 | #197 | Fair 11.7% |