Black/African American vs South American Unemployment Among Youth under 25 years
COMPARE
Black/African American
South American
Unemployment Among Youth under 25 years
Unemployment Among Youth under 25 years Comparison
Blacks/African Americans
South Americans
14.5%
UNEMPLOYMENT AMONG YOUTH UNDER 25 YEARS
0.0/ 100
METRIC RATING
317th/ 347
METRIC RANK
11.9%
UNEMPLOYMENT AMONG YOUTH UNDER 25 YEARS
8.5/ 100
METRIC RATING
213th/ 347
METRIC RANK
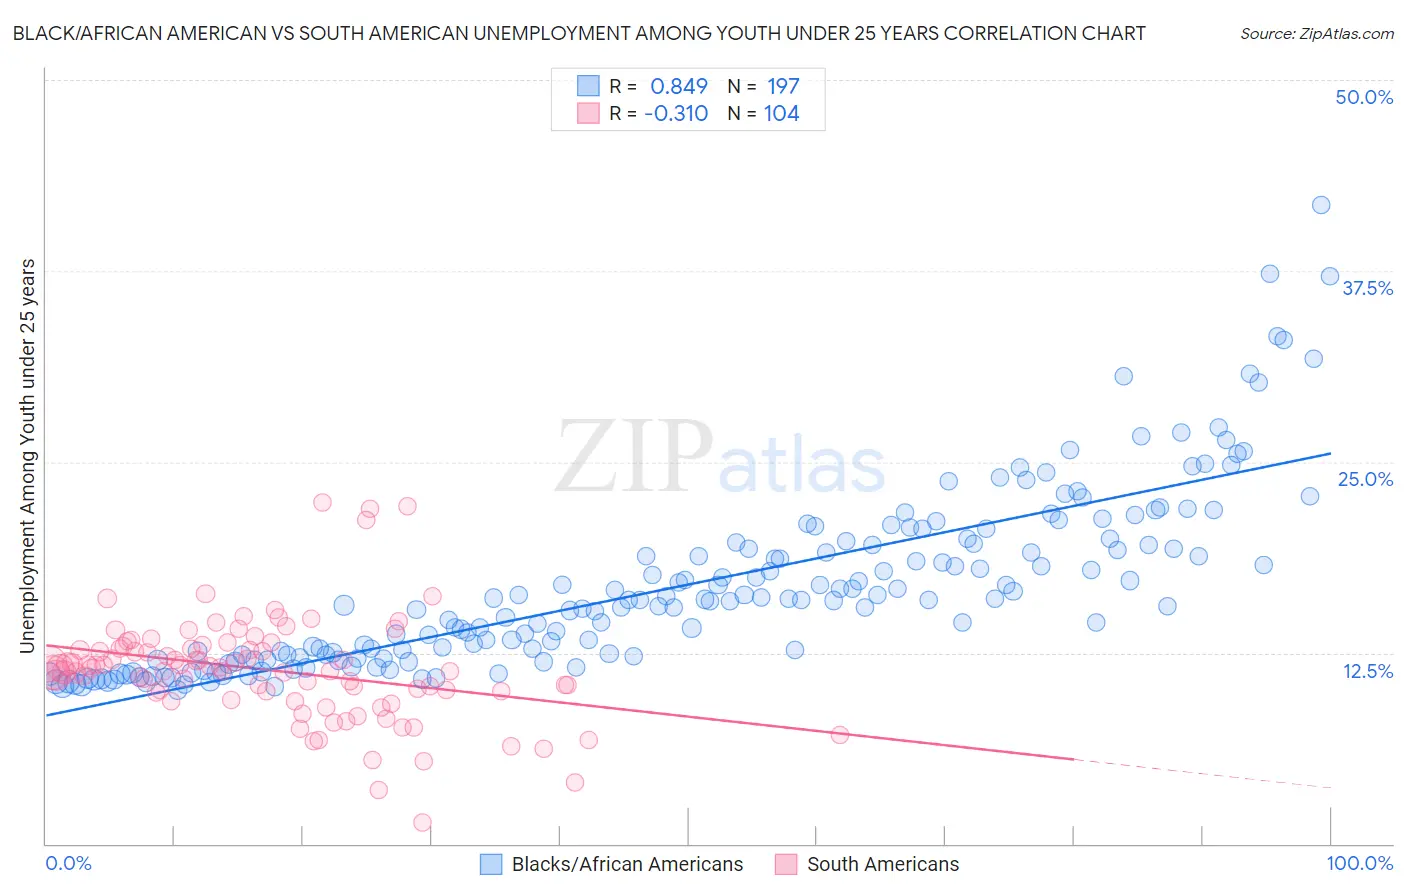
Black/African American vs South American Unemployment Among Youth under 25 years Correlation Chart
The statistical analysis conducted on geographies consisting of 545,283,249 people shows a very strong positive correlation between the proportion of Blacks/African Americans and unemployment rate among youth under the age of 25 in the United States with a correlation coefficient (R) of 0.849 and weighted average of 14.5%. Similarly, the statistical analysis conducted on geographies consisting of 484,634,947 people shows a mild negative correlation between the proportion of South Americans and unemployment rate among youth under the age of 25 in the United States with a correlation coefficient (R) of -0.310 and weighted average of 11.9%, a difference of 21.8%.
Unemployment Among Youth under 25 years Correlation Summary
| Measurement | Black/African American | South American |
| Minimum | 10.1% | 1.4% |
| Maximum | 41.8% | 22.3% |
| Range | 31.7% | 20.9% |
| Mean | 16.9% | 11.4% |
| Median | 15.9% | 11.5% |
| Interquartile 25% (IQ1) | 12.2% | 10.0% |
| Interquartile 75% (IQ3) | 19.6% | 12.9% |
| Interquartile Range (IQR) | 7.4% | 2.9% |
| Standard Deviation (Sample) | 5.8% | 3.5% |
| Standard Deviation (Population) | 5.8% | 3.4% |
Similar Demographics by Unemployment Among Youth under 25 years
Demographics Similar to Blacks/African Americans by Unemployment Among Youth under 25 years
In terms of unemployment among youth under 25 years, the demographic groups most similar to Blacks/African Americans are Native/Alaskan (14.5%, a difference of 0.090%), Sioux (14.4%, a difference of 0.51%), Jamaican (14.4%, a difference of 0.63%), Immigrants from Armenia (14.4%, a difference of 0.71%), and Immigrants from Dominica (14.6%, a difference of 0.72%).
| Demographics | Rating | Rank | Unemployment Among Youth under 25 years |
| Immigrants | West Indies | 0.0 /100 | #310 | Tragic 14.2% |
| Immigrants | Bangladesh | 0.0 /100 | #311 | Tragic 14.2% |
| Vietnamese | 0.0 /100 | #312 | Tragic 14.3% |
| Immigrants | Armenia | 0.0 /100 | #313 | Tragic 14.4% |
| Jamaicans | 0.0 /100 | #314 | Tragic 14.4% |
| Sioux | 0.0 /100 | #315 | Tragic 14.4% |
| Natives/Alaskans | 0.0 /100 | #316 | Tragic 14.5% |
| Blacks/African Americans | 0.0 /100 | #317 | Tragic 14.5% |
| Immigrants | Dominica | 0.0 /100 | #318 | Tragic 14.6% |
| West Indians | 0.0 /100 | #319 | Tragic 14.6% |
| Barbadians | 0.0 /100 | #320 | Tragic 14.6% |
| Cheyenne | 0.0 /100 | #321 | Tragic 14.6% |
| Trinidadians and Tobagonians | 0.0 /100 | #322 | Tragic 14.6% |
| Immigrants | Trinidad and Tobago | 0.0 /100 | #323 | Tragic 14.6% |
| Immigrants | Jamaica | 0.0 /100 | #324 | Tragic 14.8% |
Demographics Similar to South Americans by Unemployment Among Youth under 25 years
In terms of unemployment among youth under 25 years, the demographic groups most similar to South Americans are Costa Rican (11.9%, a difference of 0.050%), Colombian (11.9%, a difference of 0.070%), Immigrants from Philippines (11.9%, a difference of 0.090%), Samoan (11.9%, a difference of 0.15%), and Assyrian/Chaldean/Syriac (11.9%, a difference of 0.16%).
| Demographics | Rating | Rank | Unemployment Among Youth under 25 years |
| Immigrants | Pakistan | 12.6 /100 | #206 | Poor 11.8% |
| Immigrants | Southern Europe | 12.3 /100 | #207 | Poor 11.8% |
| Comanche | 12.1 /100 | #208 | Poor 11.8% |
| Immigrants | Lebanon | 11.3 /100 | #209 | Poor 11.8% |
| Assyrians/Chaldeans/Syriacs | 9.8 /100 | #210 | Tragic 11.9% |
| Immigrants | Philippines | 9.2 /100 | #211 | Tragic 11.9% |
| Colombians | 9.1 /100 | #212 | Tragic 11.9% |
| South Americans | 8.5 /100 | #213 | Tragic 11.9% |
| Costa Ricans | 8.2 /100 | #214 | Tragic 11.9% |
| Samoans | 7.4 /100 | #215 | Tragic 11.9% |
| Guamanians/Chamorros | 7.0 /100 | #216 | Tragic 11.9% |
| Yaqui | 6.9 /100 | #217 | Tragic 11.9% |
| Immigrants | Middle Africa | 6.8 /100 | #218 | Tragic 11.9% |
| Immigrants | Nonimmigrants | 6.2 /100 | #219 | Tragic 11.9% |
| Alsatians | 6.1 /100 | #220 | Tragic 11.9% |