Black/African American vs Immigrants from Senegal Unemployment Among Youth under 25 years
COMPARE
Black/African American
Immigrants from Senegal
Unemployment Among Youth under 25 years
Unemployment Among Youth under 25 years Comparison
Blacks/African Americans
Immigrants from Senegal
14.5%
UNEMPLOYMENT AMONG YOUTH UNDER 25 YEARS
0.0/ 100
METRIC RATING
317th/ 347
METRIC RANK
13.8%
UNEMPLOYMENT AMONG YOUTH UNDER 25 YEARS
0.0/ 100
METRIC RATING
301st/ 347
METRIC RANK
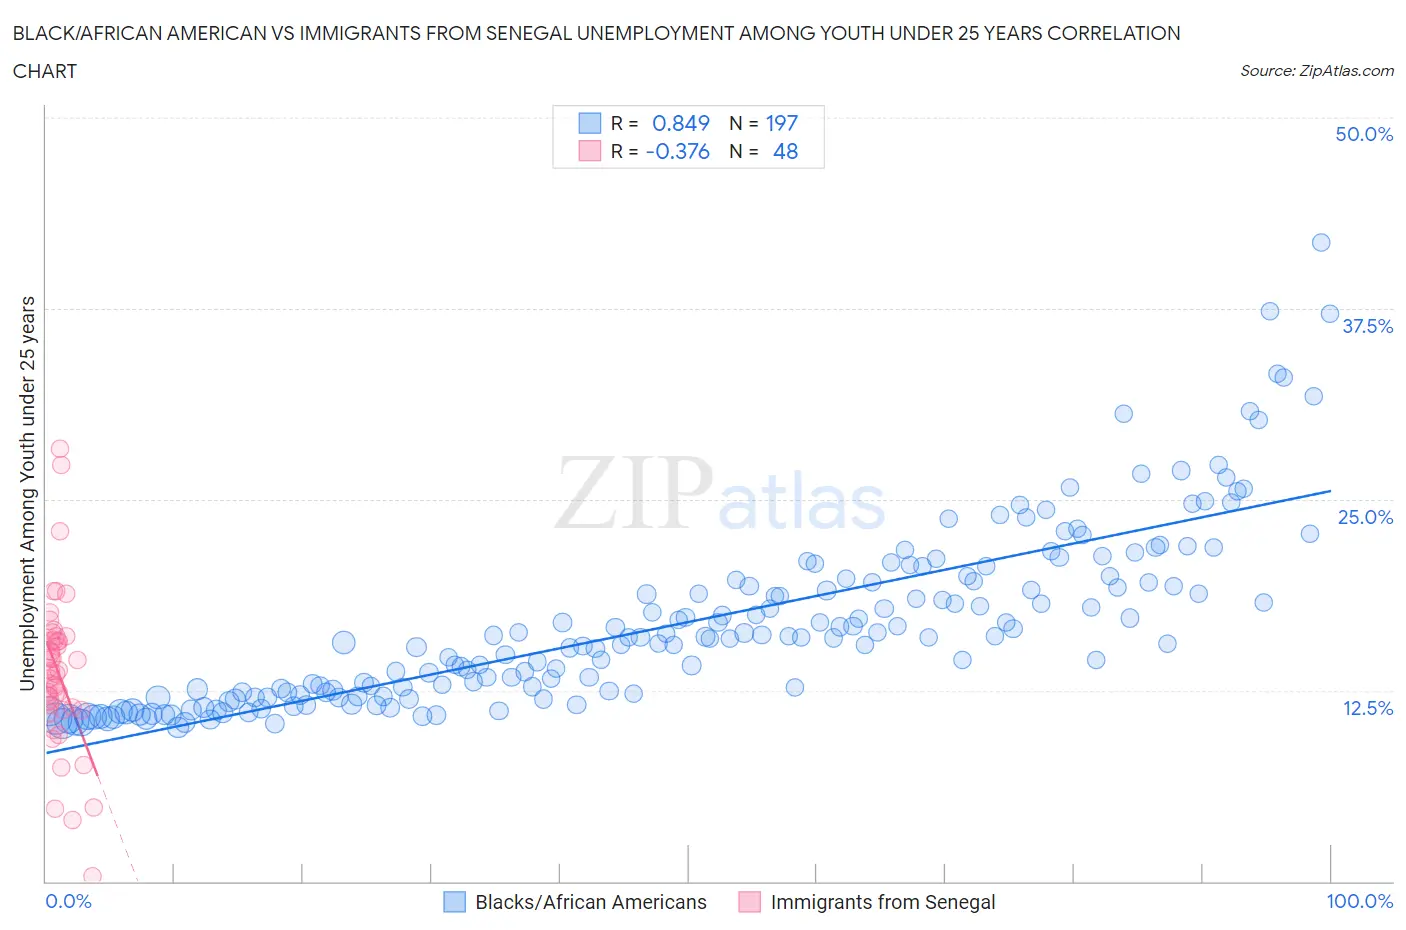
Black/African American vs Immigrants from Senegal Unemployment Among Youth under 25 years Correlation Chart
The statistical analysis conducted on geographies consisting of 545,283,249 people shows a very strong positive correlation between the proportion of Blacks/African Americans and unemployment rate among youth under the age of 25 in the United States with a correlation coefficient (R) of 0.849 and weighted average of 14.5%. Similarly, the statistical analysis conducted on geographies consisting of 90,014,443 people shows a mild negative correlation between the proportion of Immigrants from Senegal and unemployment rate among youth under the age of 25 in the United States with a correlation coefficient (R) of -0.376 and weighted average of 13.8%, a difference of 4.7%.
Unemployment Among Youth under 25 years Correlation Summary
| Measurement | Black/African American | Immigrants from Senegal |
| Minimum | 10.1% | 0.30% |
| Maximum | 41.8% | 28.3% |
| Range | 31.7% | 28.0% |
| Mean | 16.9% | 13.7% |
| Median | 15.9% | 13.8% |
| Interquartile 25% (IQ1) | 12.2% | 11.3% |
| Interquartile 75% (IQ3) | 19.6% | 15.9% |
| Interquartile Range (IQR) | 7.4% | 4.6% |
| Standard Deviation (Sample) | 5.8% | 5.1% |
| Standard Deviation (Population) | 5.8% | 5.1% |
Demographics Similar to Blacks/African Americans and Immigrants from Senegal by Unemployment Among Youth under 25 years
In terms of unemployment among youth under 25 years, the demographic groups most similar to Blacks/African Americans are Native/Alaskan (14.5%, a difference of 0.090%), Sioux (14.4%, a difference of 0.51%), Jamaican (14.4%, a difference of 0.63%), Immigrants from Armenia (14.4%, a difference of 0.71%), and Immigrants from Dominica (14.6%, a difference of 0.72%). Similarly, the demographic groups most similar to Immigrants from Senegal are Immigrants from Sierra Leone (13.8%, a difference of 0.050%), Belizean (13.8%, a difference of 0.080%), Houma (13.8%, a difference of 0.090%), Immigrants from Cabo Verde (13.8%, a difference of 0.17%), and Tohono O'odham (13.8%, a difference of 0.38%).
| Demographics | Rating | Rank | Unemployment Among Youth under 25 years |
| Tohono O'odham | 0.0 /100 | #299 | Tragic 13.8% |
| Immigrants | Cabo Verde | 0.0 /100 | #300 | Tragic 13.8% |
| Immigrants | Senegal | 0.0 /100 | #301 | Tragic 13.8% |
| Immigrants | Sierra Leone | 0.0 /100 | #302 | Tragic 13.8% |
| Belizeans | 0.0 /100 | #303 | Tragic 13.8% |
| Houma | 0.0 /100 | #304 | Tragic 13.8% |
| Haitians | 0.0 /100 | #305 | Tragic 13.9% |
| Pueblo | 0.0 /100 | #306 | Tragic 13.9% |
| Immigrants | Haiti | 0.0 /100 | #307 | Tragic 14.0% |
| Immigrants | Belize | 0.0 /100 | #308 | Tragic 14.0% |
| Aleuts | 0.0 /100 | #309 | Tragic 14.1% |
| Immigrants | West Indies | 0.0 /100 | #310 | Tragic 14.2% |
| Immigrants | Bangladesh | 0.0 /100 | #311 | Tragic 14.2% |
| Vietnamese | 0.0 /100 | #312 | Tragic 14.3% |
| Immigrants | Armenia | 0.0 /100 | #313 | Tragic 14.4% |
| Jamaicans | 0.0 /100 | #314 | Tragic 14.4% |
| Sioux | 0.0 /100 | #315 | Tragic 14.4% |
| Natives/Alaskans | 0.0 /100 | #316 | Tragic 14.5% |
| Blacks/African Americans | 0.0 /100 | #317 | Tragic 14.5% |
| Immigrants | Dominica | 0.0 /100 | #318 | Tragic 14.6% |
| West Indians | 0.0 /100 | #319 | Tragic 14.6% |