Black/African American vs Ghanaian Unemployment Among Youth under 25 years
COMPARE
Black/African American
Ghanaian
Unemployment Among Youth under 25 years
Unemployment Among Youth under 25 years Comparison
Blacks/African Americans
Ghanaians
14.5%
UNEMPLOYMENT AMONG YOUTH UNDER 25 YEARS
0.0/ 100
METRIC RATING
317th/ 347
METRIC RANK
13.3%
UNEMPLOYMENT AMONG YOUTH UNDER 25 YEARS
0.0/ 100
METRIC RATING
285th/ 347
METRIC RANK
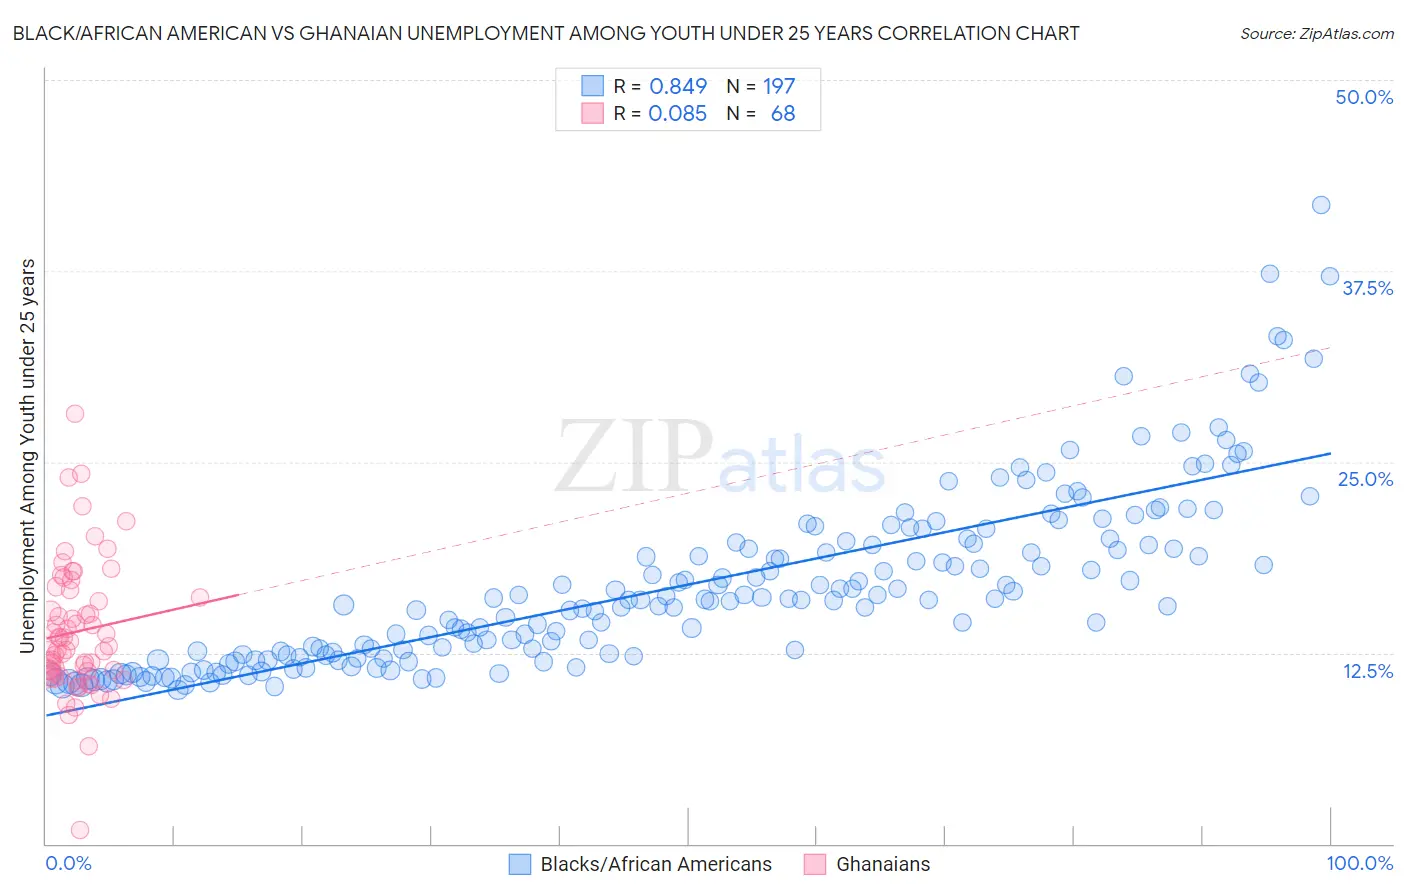
Black/African American vs Ghanaian Unemployment Among Youth under 25 years Correlation Chart
The statistical analysis conducted on geographies consisting of 545,283,249 people shows a very strong positive correlation between the proportion of Blacks/African Americans and unemployment rate among youth under the age of 25 in the United States with a correlation coefficient (R) of 0.849 and weighted average of 14.5%. Similarly, the statistical analysis conducted on geographies consisting of 190,112,993 people shows a slight positive correlation between the proportion of Ghanaians and unemployment rate among youth under the age of 25 in the United States with a correlation coefficient (R) of 0.085 and weighted average of 13.3%, a difference of 8.8%.
Unemployment Among Youth under 25 years Correlation Summary
| Measurement | Black/African American | Ghanaian |
| Minimum | 10.1% | 0.90% |
| Maximum | 41.8% | 28.2% |
| Range | 31.7% | 27.3% |
| Mean | 16.9% | 13.9% |
| Median | 15.9% | 13.1% |
| Interquartile 25% (IQ1) | 12.2% | 11.3% |
| Interquartile 75% (IQ3) | 19.6% | 16.3% |
| Interquartile Range (IQR) | 7.4% | 5.1% |
| Standard Deviation (Sample) | 5.8% | 4.4% |
| Standard Deviation (Population) | 5.8% | 4.3% |
Similar Demographics by Unemployment Among Youth under 25 years
Demographics Similar to Blacks/African Americans by Unemployment Among Youth under 25 years
In terms of unemployment among youth under 25 years, the demographic groups most similar to Blacks/African Americans are Native/Alaskan (14.5%, a difference of 0.090%), Sioux (14.4%, a difference of 0.51%), Jamaican (14.4%, a difference of 0.63%), Immigrants from Armenia (14.4%, a difference of 0.71%), and Immigrants from Dominica (14.6%, a difference of 0.72%).
| Demographics | Rating | Rank | Unemployment Among Youth under 25 years |
| Immigrants | West Indies | 0.0 /100 | #310 | Tragic 14.2% |
| Immigrants | Bangladesh | 0.0 /100 | #311 | Tragic 14.2% |
| Vietnamese | 0.0 /100 | #312 | Tragic 14.3% |
| Immigrants | Armenia | 0.0 /100 | #313 | Tragic 14.4% |
| Jamaicans | 0.0 /100 | #314 | Tragic 14.4% |
| Sioux | 0.0 /100 | #315 | Tragic 14.4% |
| Natives/Alaskans | 0.0 /100 | #316 | Tragic 14.5% |
| Blacks/African Americans | 0.0 /100 | #317 | Tragic 14.5% |
| Immigrants | Dominica | 0.0 /100 | #318 | Tragic 14.6% |
| West Indians | 0.0 /100 | #319 | Tragic 14.6% |
| Barbadians | 0.0 /100 | #320 | Tragic 14.6% |
| Cheyenne | 0.0 /100 | #321 | Tragic 14.6% |
| Trinidadians and Tobagonians | 0.0 /100 | #322 | Tragic 14.6% |
| Immigrants | Trinidad and Tobago | 0.0 /100 | #323 | Tragic 14.6% |
| Immigrants | Jamaica | 0.0 /100 | #324 | Tragic 14.8% |
Demographics Similar to Ghanaians by Unemployment Among Youth under 25 years
In terms of unemployment among youth under 25 years, the demographic groups most similar to Ghanaians are Blackfeet (13.3%, a difference of 0.050%), Ecuadorian (13.3%, a difference of 0.060%), Lumbee (13.3%, a difference of 0.090%), Immigrants from Cameroon (13.3%, a difference of 0.10%), and Sierra Leonean (13.3%, a difference of 0.12%).
| Demographics | Rating | Rank | Unemployment Among Youth under 25 years |
| Africans | 0.0 /100 | #278 | Tragic 13.2% |
| Cajuns | 0.0 /100 | #279 | Tragic 13.2% |
| Ute | 0.0 /100 | #280 | Tragic 13.3% |
| Armenians | 0.0 /100 | #281 | Tragic 13.3% |
| Sierra Leoneans | 0.0 /100 | #282 | Tragic 13.3% |
| Immigrants | Cameroon | 0.0 /100 | #283 | Tragic 13.3% |
| Lumbee | 0.0 /100 | #284 | Tragic 13.3% |
| Ghanaians | 0.0 /100 | #285 | Tragic 13.3% |
| Blackfeet | 0.0 /100 | #286 | Tragic 13.3% |
| Ecuadorians | 0.0 /100 | #287 | Tragic 13.3% |
| Immigrants | Western Africa | 0.0 /100 | #288 | Tragic 13.4% |
| Immigrants | Ghana | 0.0 /100 | #289 | Tragic 13.4% |
| Immigrants | Ecuador | 0.0 /100 | #290 | Tragic 13.4% |
| Apache | 0.0 /100 | #291 | Tragic 13.5% |
| Central American Indians | 0.0 /100 | #292 | Tragic 13.5% |