Black/African American vs Osage Unemployment Among Youth under 25 years
COMPARE
Black/African American
Osage
Unemployment Among Youth under 25 years
Unemployment Among Youth under 25 years Comparison
Blacks/African Americans
Osage
14.5%
UNEMPLOYMENT AMONG YOUTH UNDER 25 YEARS
0.0/ 100
METRIC RATING
317th/ 347
METRIC RANK
10.7%
UNEMPLOYMENT AMONG YOUTH UNDER 25 YEARS
99.9/ 100
METRIC RATING
30th/ 347
METRIC RANK
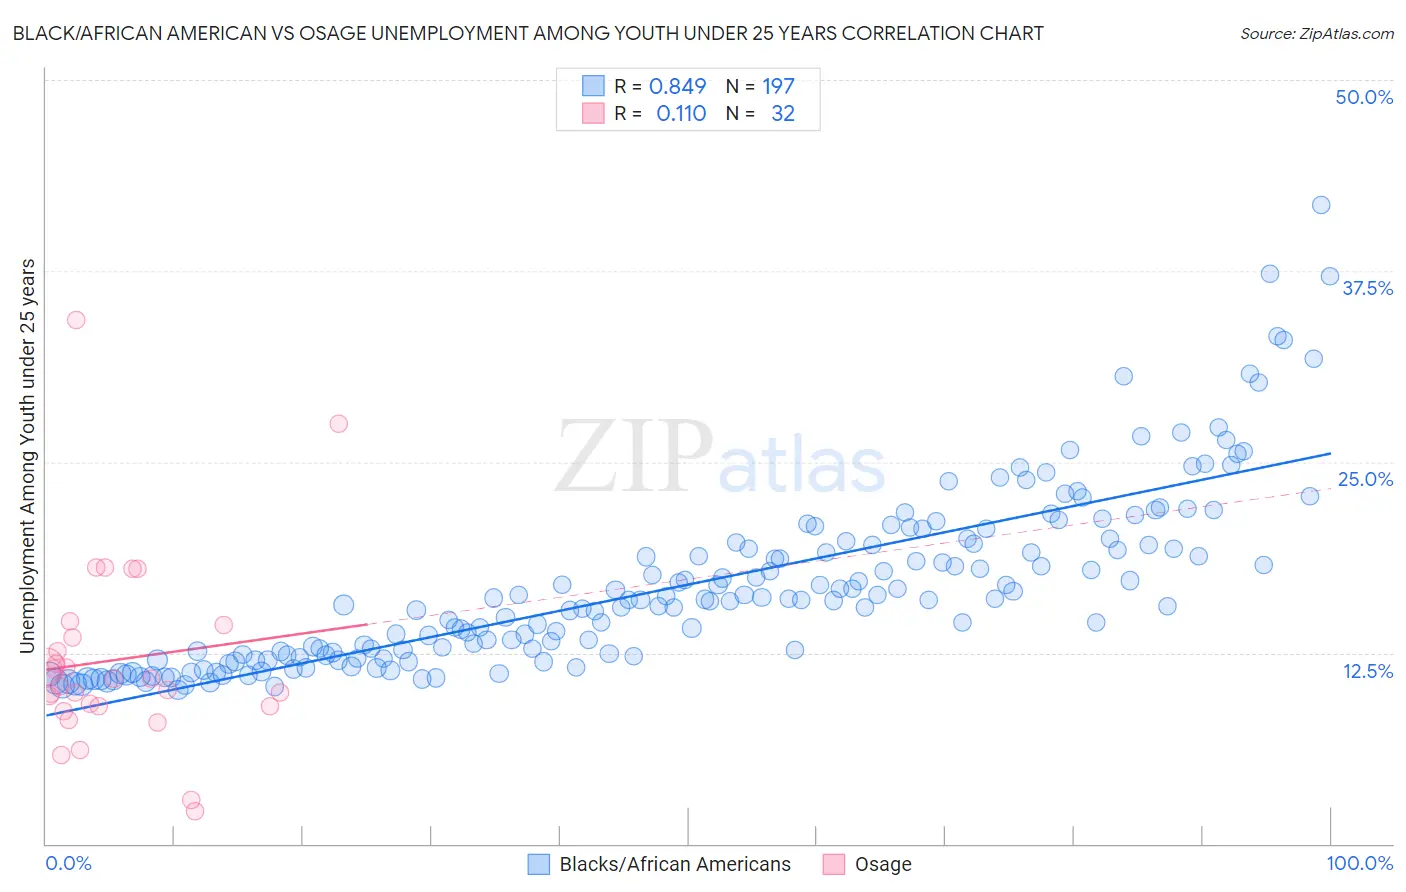
Black/African American vs Osage Unemployment Among Youth under 25 years Correlation Chart
The statistical analysis conducted on geographies consisting of 545,283,249 people shows a very strong positive correlation between the proportion of Blacks/African Americans and unemployment rate among youth under the age of 25 in the United States with a correlation coefficient (R) of 0.849 and weighted average of 14.5%. Similarly, the statistical analysis conducted on geographies consisting of 91,372,569 people shows a poor positive correlation between the proportion of Osage and unemployment rate among youth under the age of 25 in the United States with a correlation coefficient (R) of 0.110 and weighted average of 10.7%, a difference of 35.1%.
Unemployment Among Youth under 25 years Correlation Summary
| Measurement | Black/African American | Osage |
| Minimum | 10.1% | 2.1% |
| Maximum | 41.8% | 34.2% |
| Range | 31.7% | 32.1% |
| Mean | 16.9% | 12.1% |
| Median | 15.9% | 10.5% |
| Interquartile 25% (IQ1) | 12.2% | 9.0% |
| Interquartile 75% (IQ3) | 19.6% | 13.9% |
| Interquartile Range (IQR) | 7.4% | 4.9% |
| Standard Deviation (Sample) | 5.8% | 6.3% |
| Standard Deviation (Population) | 5.8% | 6.2% |
Similar Demographics by Unemployment Among Youth under 25 years
Demographics Similar to Blacks/African Americans by Unemployment Among Youth under 25 years
In terms of unemployment among youth under 25 years, the demographic groups most similar to Blacks/African Americans are Native/Alaskan (14.5%, a difference of 0.090%), Sioux (14.4%, a difference of 0.51%), Jamaican (14.4%, a difference of 0.63%), Immigrants from Armenia (14.4%, a difference of 0.71%), and Immigrants from Dominica (14.6%, a difference of 0.72%).
| Demographics | Rating | Rank | Unemployment Among Youth under 25 years |
| Immigrants | West Indies | 0.0 /100 | #310 | Tragic 14.2% |
| Immigrants | Bangladesh | 0.0 /100 | #311 | Tragic 14.2% |
| Vietnamese | 0.0 /100 | #312 | Tragic 14.3% |
| Immigrants | Armenia | 0.0 /100 | #313 | Tragic 14.4% |
| Jamaicans | 0.0 /100 | #314 | Tragic 14.4% |
| Sioux | 0.0 /100 | #315 | Tragic 14.4% |
| Natives/Alaskans | 0.0 /100 | #316 | Tragic 14.5% |
| Blacks/African Americans | 0.0 /100 | #317 | Tragic 14.5% |
| Immigrants | Dominica | 0.0 /100 | #318 | Tragic 14.6% |
| West Indians | 0.0 /100 | #319 | Tragic 14.6% |
| Barbadians | 0.0 /100 | #320 | Tragic 14.6% |
| Cheyenne | 0.0 /100 | #321 | Tragic 14.6% |
| Trinidadians and Tobagonians | 0.0 /100 | #322 | Tragic 14.6% |
| Immigrants | Trinidad and Tobago | 0.0 /100 | #323 | Tragic 14.6% |
| Immigrants | Jamaica | 0.0 /100 | #324 | Tragic 14.8% |
Demographics Similar to Osage by Unemployment Among Youth under 25 years
In terms of unemployment among youth under 25 years, the demographic groups most similar to Osage are Chinese (10.7%, a difference of 0.060%), Slovene (10.7%, a difference of 0.11%), Taiwanese (10.8%, a difference of 0.37%), Somali (10.7%, a difference of 0.41%), and Yugoslavian (10.7%, a difference of 0.45%).
| Demographics | Rating | Rank | Unemployment Among Youth under 25 years |
| Immigrants | Bosnia and Herzegovina | 100.0 /100 | #23 | Exceptional 10.6% |
| Finns | 100.0 /100 | #24 | Exceptional 10.7% |
| Immigrants | North Macedonia | 100.0 /100 | #25 | Exceptional 10.7% |
| Immigrants | India | 100.0 /100 | #26 | Exceptional 10.7% |
| Yugoslavians | 100.0 /100 | #27 | Exceptional 10.7% |
| Somalis | 100.0 /100 | #28 | Exceptional 10.7% |
| Chinese | 99.9 /100 | #29 | Exceptional 10.7% |
| Osage | 99.9 /100 | #30 | Exceptional 10.7% |
| Slovenes | 99.9 /100 | #31 | Exceptional 10.7% |
| Taiwanese | 99.9 /100 | #32 | Exceptional 10.8% |
| Europeans | 99.9 /100 | #33 | Exceptional 10.8% |
| English | 99.9 /100 | #34 | Exceptional 10.8% |
| Immigrants | Nepal | 99.9 /100 | #35 | Exceptional 10.8% |
| Hmong | 99.8 /100 | #36 | Exceptional 10.8% |
| Immigrants | Zimbabwe | 99.8 /100 | #37 | Exceptional 10.8% |