Bhutanese vs South African Unemployment Among Women with Children Ages 6 to 17 years
COMPARE
Bhutanese
South African
Unemployment Among Women with Children Ages 6 to 17 years
Unemployment Among Women with Children Ages 6 to 17 years Comparison
Bhutanese
South Africans
8.1%
UNEMPLOYMENT AMONG WOMEN WITH CHILDREN AGES 6 TO 17 YEARS
100.0/ 100
METRIC RATING
43rd/ 347
METRIC RANK
8.7%
UNEMPLOYMENT AMONG WOMEN WITH CHILDREN AGES 6 TO 17 YEARS
94.6/ 100
METRIC RATING
125th/ 347
METRIC RANK
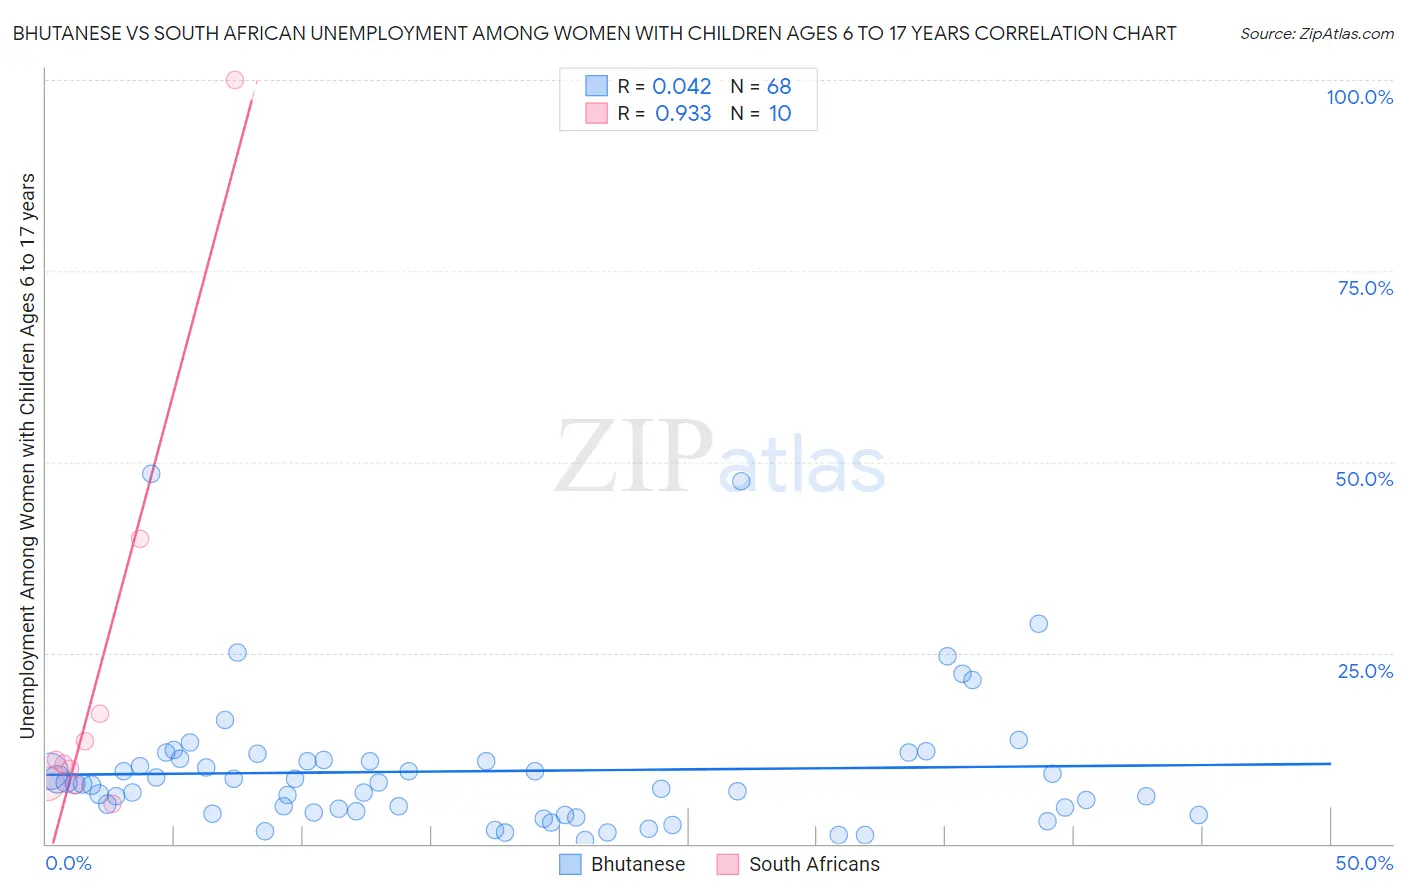
Bhutanese vs South African Unemployment Among Women with Children Ages 6 to 17 years Correlation Chart
The statistical analysis conducted on geographies consisting of 316,750,303 people shows no correlation between the proportion of Bhutanese and unemployment rate among women with children between the ages 6 and 17 in the United States with a correlation coefficient (R) of 0.042 and weighted average of 8.1%. Similarly, the statistical analysis conducted on geographies consisting of 145,059,046 people shows a near-perfect positive correlation between the proportion of South Africans and unemployment rate among women with children between the ages 6 and 17 in the United States with a correlation coefficient (R) of 0.933 and weighted average of 8.7%, a difference of 7.7%.
Unemployment Among Women with Children Ages 6 to 17 years Correlation Summary
| Measurement | Bhutanese | South African |
| Minimum | 0.50% | 5.3% |
| Maximum | 48.4% | 100.0% |
| Range | 47.9% | 94.7% |
| Mean | 9.5% | 22.3% |
| Median | 7.8% | 10.7% |
| Interquartile 25% (IQ1) | 4.1% | 7.9% |
| Interquartile 75% (IQ3) | 10.9% | 17.0% |
| Interquartile Range (IQR) | 6.8% | 9.1% |
| Standard Deviation (Sample) | 8.9% | 29.0% |
| Standard Deviation (Population) | 8.8% | 27.6% |
Similar Demographics by Unemployment Among Women with Children Ages 6 to 17 years
Demographics Similar to Bhutanese by Unemployment Among Women with Children Ages 6 to 17 years
In terms of unemployment among women with children ages 6 to 17 years, the demographic groups most similar to Bhutanese are Immigrants from Sweden (8.1%, a difference of 0.040%), Immigrants from Bulgaria (8.1%, a difference of 0.080%), Icelander (8.1%, a difference of 0.10%), Immigrants from Somalia (8.0%, a difference of 0.14%), and Immigrants from Switzerland (8.1%, a difference of 0.14%).
| Demographics | Rating | Rank | Unemployment Among Women with Children Ages 6 to 17 years |
| Burmese | 100.0 /100 | #36 | Exceptional 8.0% |
| Asians | 100.0 /100 | #37 | Exceptional 8.0% |
| Alsatians | 100.0 /100 | #38 | Exceptional 8.0% |
| Somalis | 100.0 /100 | #39 | Exceptional 8.0% |
| Immigrants | Zimbabwe | 100.0 /100 | #40 | Exceptional 8.0% |
| Iranians | 100.0 /100 | #41 | Exceptional 8.0% |
| Immigrants | Somalia | 100.0 /100 | #42 | Exceptional 8.0% |
| Bhutanese | 100.0 /100 | #43 | Exceptional 8.1% |
| Immigrants | Sweden | 100.0 /100 | #44 | Exceptional 8.1% |
| Immigrants | Bulgaria | 100.0 /100 | #45 | Exceptional 8.1% |
| Icelanders | 100.0 /100 | #46 | Exceptional 8.1% |
| Immigrants | Switzerland | 100.0 /100 | #47 | Exceptional 8.1% |
| Immigrants | Asia | 100.0 /100 | #48 | Exceptional 8.1% |
| Immigrants | Oceania | 100.0 /100 | #49 | Exceptional 8.1% |
| Hawaiians | 100.0 /100 | #50 | Exceptional 8.1% |
Demographics Similar to South Africans by Unemployment Among Women with Children Ages 6 to 17 years
In terms of unemployment among women with children ages 6 to 17 years, the demographic groups most similar to South Africans are Immigrants from Northern Africa (8.7%, a difference of 0.030%), Czech (8.7%, a difference of 0.030%), Hmong (8.7%, a difference of 0.050%), Immigrants from Morocco (8.7%, a difference of 0.070%), and Immigrants from Lebanon (8.7%, a difference of 0.070%).
| Demographics | Rating | Rank | Unemployment Among Women with Children Ages 6 to 17 years |
| Pueblo | 96.2 /100 | #118 | Exceptional 8.6% |
| Immigrants | Grenada | 96.2 /100 | #119 | Exceptional 8.6% |
| Israelis | 95.9 /100 | #120 | Exceptional 8.7% |
| Immigrants | Denmark | 95.5 /100 | #121 | Exceptional 8.7% |
| Immigrants | Egypt | 95.0 /100 | #122 | Exceptional 8.7% |
| Immigrants | Morocco | 94.9 /100 | #123 | Exceptional 8.7% |
| Immigrants | Lebanon | 94.9 /100 | #124 | Exceptional 8.7% |
| South Africans | 94.6 /100 | #125 | Exceptional 8.7% |
| Immigrants | Northern Africa | 94.4 /100 | #126 | Exceptional 8.7% |
| Czechs | 94.4 /100 | #127 | Exceptional 8.7% |
| Hmong | 94.3 /100 | #128 | Exceptional 8.7% |
| Barbadians | 93.8 /100 | #129 | Exceptional 8.7% |
| Immigrants | Western Asia | 93.1 /100 | #130 | Exceptional 8.7% |
| Slavs | 92.2 /100 | #131 | Exceptional 8.7% |
| Yaqui | 92.2 /100 | #132 | Exceptional 8.7% |