Bhutanese vs Black/African American Unemployment
COMPARE
Bhutanese
Black/African American
Unemployment
Unemployment Comparison
Bhutanese
Blacks/African Americans
4.9%
UNEMPLOYMENT
99.0/ 100
METRIC RATING
59th/ 347
METRIC RANK
6.6%
UNEMPLOYMENT
0.0/ 100
METRIC RATING
314th/ 347
METRIC RANK
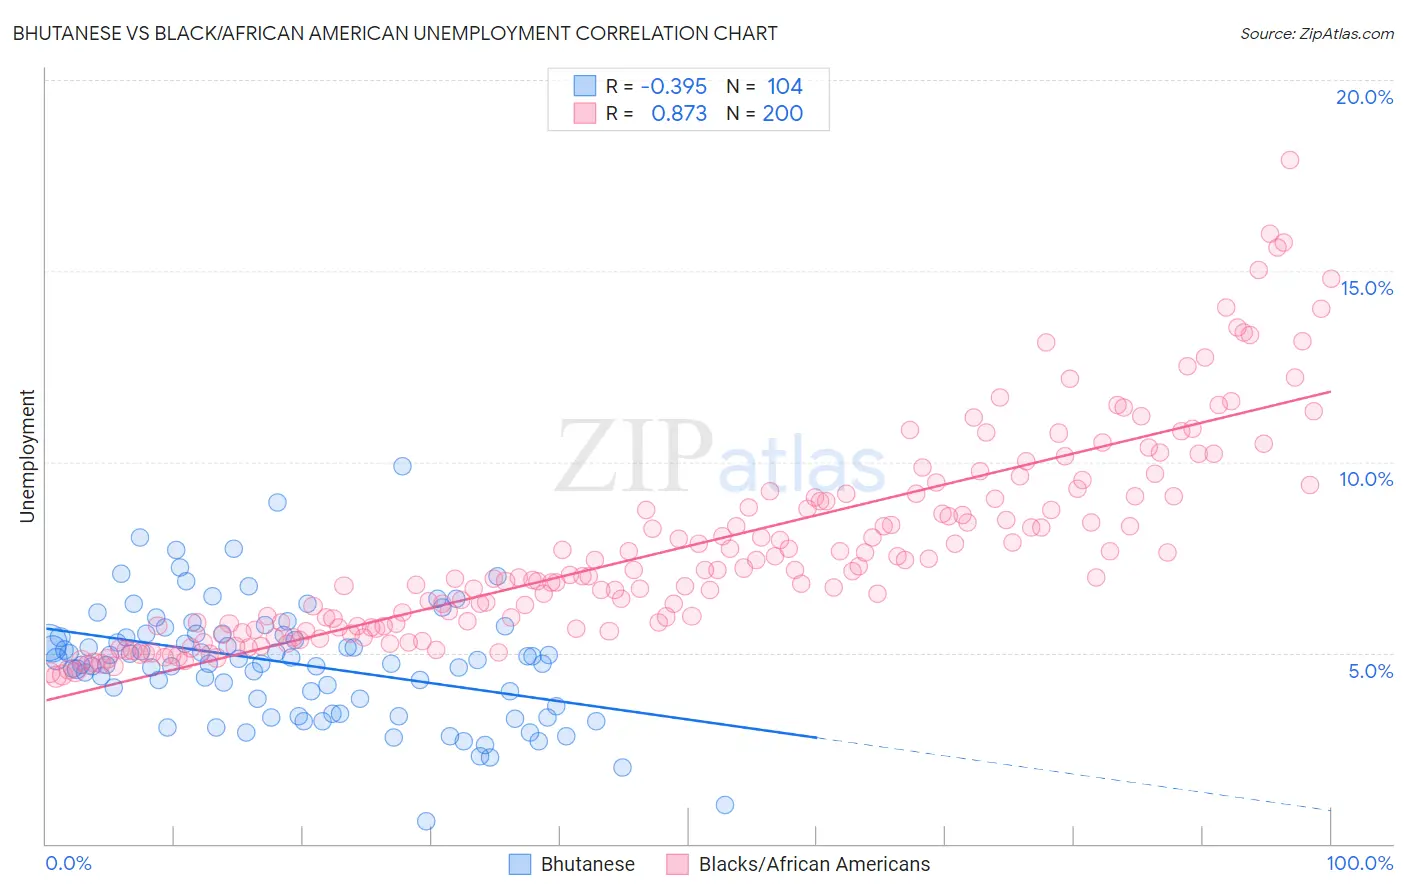
Bhutanese vs Black/African American Unemployment Correlation Chart
The statistical analysis conducted on geographies consisting of 454,875,452 people shows a mild negative correlation between the proportion of Bhutanese and unemployment in the United States with a correlation coefficient (R) of -0.395 and weighted average of 4.9%. Similarly, the statistical analysis conducted on geographies consisting of 562,987,434 people shows a very strong positive correlation between the proportion of Blacks/African Americans and unemployment in the United States with a correlation coefficient (R) of 0.873 and weighted average of 6.6%, a difference of 35.7%.
Unemployment Correlation Summary
| Measurement | Bhutanese | Black/African American |
| Minimum | 0.60% | 4.4% |
| Maximum | 9.9% | 17.9% |
| Range | 9.3% | 13.5% |
| Mean | 4.7% | 7.8% |
| Median | 4.8% | 7.1% |
| Interquartile 25% (IQ1) | 3.7% | 5.7% |
| Interquartile 75% (IQ3) | 5.5% | 9.1% |
| Interquartile Range (IQR) | 1.8% | 3.4% |
| Standard Deviation (Sample) | 1.5% | 2.7% |
| Standard Deviation (Population) | 1.5% | 2.7% |
Similar Demographics by Unemployment
Demographics Similar to Bhutanese by Unemployment
In terms of unemployment, the demographic groups most similar to Bhutanese are Greek (4.9%, a difference of 0.030%), Immigrants from Netherlands (4.9%, a difference of 0.050%), Cambodian (4.9%, a difference of 0.050%), Icelander (4.9%, a difference of 0.060%), and Immigrants from Bulgaria (4.9%, a difference of 0.070%).
| Demographics | Rating | Rank | Unemployment |
| Whites/Caucasians | 99.2 /100 | #52 | Exceptional 4.9% |
| Immigrants | Zimbabwe | 99.2 /100 | #53 | Exceptional 4.9% |
| Eastern Europeans | 99.2 /100 | #54 | Exceptional 4.9% |
| Australians | 99.2 /100 | #55 | Exceptional 4.9% |
| Celtics | 99.1 /100 | #56 | Exceptional 4.9% |
| Immigrants | Singapore | 99.1 /100 | #57 | Exceptional 4.9% |
| Greeks | 99.0 /100 | #58 | Exceptional 4.9% |
| Bhutanese | 99.0 /100 | #59 | Exceptional 4.9% |
| Immigrants | Netherlands | 99.0 /100 | #60 | Exceptional 4.9% |
| Cambodians | 99.0 /100 | #61 | Exceptional 4.9% |
| Icelanders | 98.9 /100 | #62 | Exceptional 4.9% |
| Immigrants | Bulgaria | 98.9 /100 | #63 | Exceptional 4.9% |
| Italians | 98.9 /100 | #64 | Exceptional 4.9% |
| Immigrants | Canada | 98.8 /100 | #65 | Exceptional 4.9% |
| Slovaks | 98.7 /100 | #66 | Exceptional 4.9% |
Demographics Similar to Blacks/African Americans by Unemployment
In terms of unemployment, the demographic groups most similar to Blacks/African Americans are Immigrants from Barbados (6.6%, a difference of 0.55%), Houma (6.7%, a difference of 0.80%), Colville (6.6%, a difference of 0.93%), Cape Verdean (6.5%, a difference of 1.5%), and Immigrants from Dominica (6.7%, a difference of 1.6%).
| Demographics | Rating | Rank | Unemployment |
| Immigrants | Bangladesh | 0.0 /100 | #307 | Tragic 6.5% |
| Barbadians | 0.0 /100 | #308 | Tragic 6.5% |
| Vietnamese | 0.0 /100 | #309 | Tragic 6.5% |
| Immigrants | Belize | 0.0 /100 | #310 | Tragic 6.5% |
| Cape Verdeans | 0.0 /100 | #311 | Tragic 6.5% |
| Colville | 0.0 /100 | #312 | Tragic 6.6% |
| Immigrants | Barbados | 0.0 /100 | #313 | Tragic 6.6% |
| Blacks/African Americans | 0.0 /100 | #314 | Tragic 6.6% |
| Houma | 0.0 /100 | #315 | Tragic 6.7% |
| Immigrants | Dominica | 0.0 /100 | #316 | Tragic 6.7% |
| Shoshone | 0.0 /100 | #317 | Tragic 6.8% |
| Immigrants | Cabo Verde | 0.0 /100 | #318 | Tragic 6.8% |
| British West Indians | 0.0 /100 | #319 | Tragic 6.8% |
| Immigrants | St. Vincent and the Grenadines | 0.0 /100 | #320 | Tragic 6.9% |
| Immigrants | Guyana | 0.0 /100 | #321 | Tragic 6.9% |